Cost & Savings
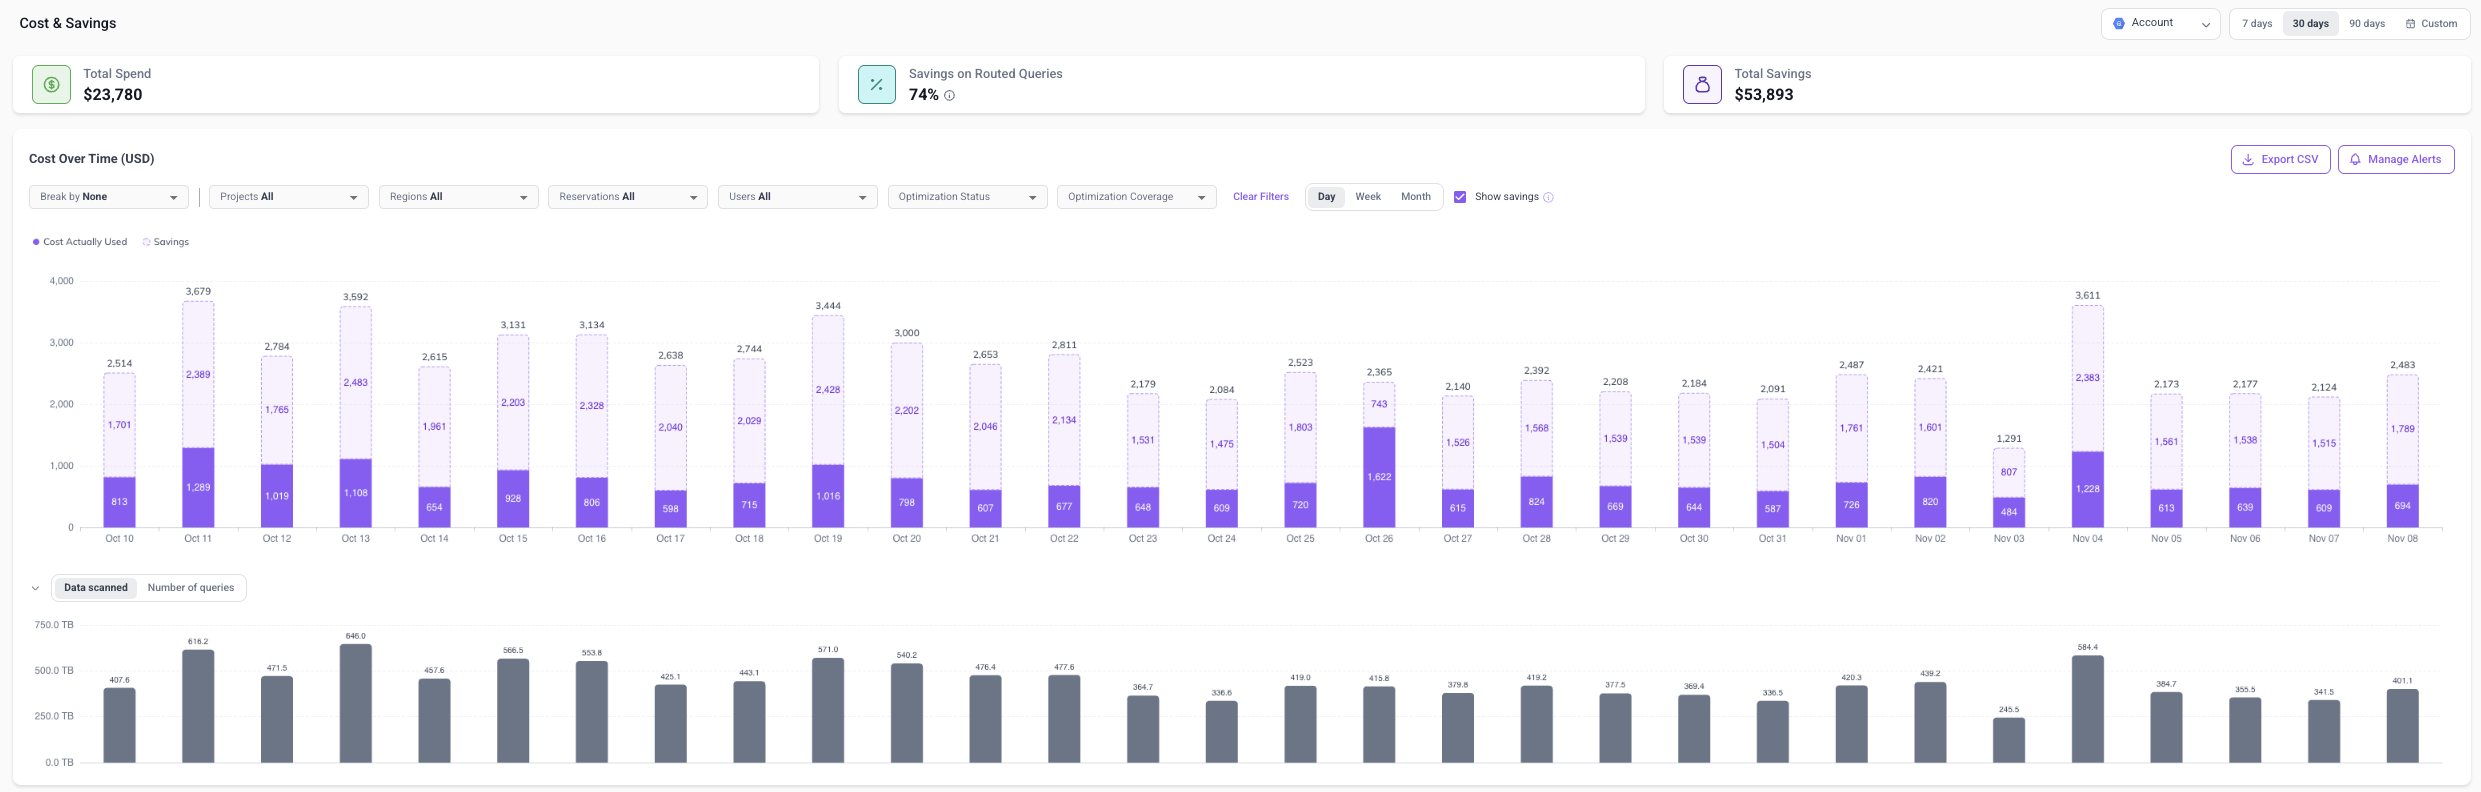
The Cost & Savings page is Yuki's main dashboard for BigQuery spend. It combines what you spent, what Yuki saved you, and where the cost comes from into a single view.
Page Overview
At the top, three summary cards:
| Metric | Description |
|---|---|
| Total Spend | Your total BigQuery cost (in dollars) for the selected time range |
| Savings on Routed Queries | Cost reduction divided by baseline cost, for queries routed through Yuki only |
| Total Savings | Total savings achieved (in dollars) for the selected time range |
The cards reflect the filters applied to the Cost Over Time chart below.
Use the time range selector (top right) to choose 7 days, 30 days, 90 days, or a Custom range, and the Account selector to switch between connected BigQuery accounts.
Cost Over Time Chart
The main chart shows cost over time, with Cost Actually Used (solid bars) and Savings (dashed, lighter bars) stacked together so you can see both what you spent and what Yuki saved you.
- Switch the time granularity between Day, Week, and Month
- Toggle Show savings to hide the savings portion and see actual spend only
- Filter by Projects, Regions, Reservations (shown only if you use reservations), or Users
- Filter by Optimization Status (projects with Yuki optimization enabled or disabled) or Optimization Coverage (jobs routed or not routed through Yuki), and click Clear Filters to reset them
- Export CSV to download the underlying data, including cost with and without Yuki, savings, optimization coverage, and the number of queries not routed through Yuki
- Manage Alerts to set up cost and anomaly alerts (see Cost & Anomaly Alerts)
Below the cost chart, a second chart shows workload volume for the same period. Toggle it between Data scanned and Number of queries to see whether a change in cost lines up with a change in activity, or collapse it with the arrow on the left.

Break By
Use the Break by dropdown to split each bar and see where the cost comes from. Hovering over a bar shows a tooltip with the breakdown for that period.
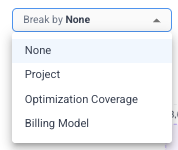
| Break by | What it shows |
|---|---|
| None | A single bar per period - total cost actually used, plus savings if Show savings is on |
| Project | One segment per project for your top 6 projects by cost, with the rest grouped as Other |
| Optimization Coverage | Splits spend by whether Yuki had a chance to optimize it: Routed Through Yuki is spend from queries that went through the Yuki Proxy. Not Routed Through Yuki is spend from queries that connected to BigQuery directly, bypassing the proxy - Yuki never saw these queries, so they weren't optimized. This is the default view |
| Billing Model | Splits spend between On Demand and Reservations pricing. Shown only when billing model data is available |
Drilling Down
When breaking by Project or Optimization Coverage, click a segment in the chart to break it down further. For example, click the Not Routed Through Yuki segment and pick Project to see which projects are sending queries directly to BigQuery.
Project Breakdown
A table listing every project with its cost, share of total spend, optimization coverage, and whether Yuki optimization is enabled. Use the search box to find a specific project.
| Column | Description |
|---|---|
| Project Name | The BigQuery project associated with the spend |
| Cost | Cost in dollars - the table is sorted by cost by default |
| % Of Total Spend | The project's share of your total spend |
| Last Week Optimization Coverage | The percentage of the project's spend over the last week that was routed through Yuki. The arrow shows whether that share trended up or down across the week |
| Optimization | Whether Yuki optimization is Enabled or Disabled for the project |

When Break by is set to Optimization Coverage or Billing Model, this section can switch to a Summary view that shows the cost and share of total spend for each group instead of each project.
Optimization Coverage Details
Click the arrow at the end of a project row to open its Optimization Coverage details - useful for finding which users aren't sending their queries through Yuki, so you can close adoption gaps:
- Coverage over time - the share of the project's spend routed through Yuki, shown Daily or Weekly, with the average for the period
- Routing by user - each user's percentage of optimized queries, and the potential savings if the rest were routed through Yuki
- Top queries - select a user to see their top queries with Job ID, Slot Hours, and cost. Click a Job ID to open it in the BigQuery console
Cost & Anomaly Alerts
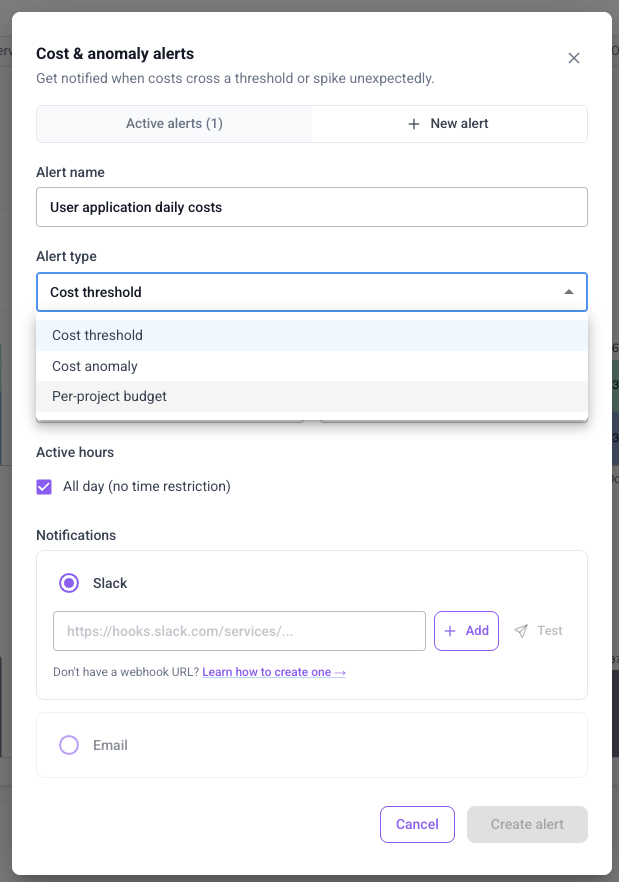
Click Manage Alerts to get notified when costs cross a threshold or spike unexpectedly.
- Click New alert and give it a name
- Choose an Alert type:
- Cost threshold - alert when total spend in the selected period exceeds a dollar amount
- Cost anomaly - alert when spend for the selected period exceeds its historical average by more than the configured Sensitivity (%)
- Per-project budget - alert when any single project's spend in the selected period exceeds the Default budget ($)
- Set the alert's value (threshold, sensitivity, or budget) and the Period (Daily, Weekly, or Monthly)
- Optionally restrict alerts to specific Active hours, in your local timezone or UTC
- Choose how to be notified - Slack (via webhook URL) and/or Email - and click Create alert
How to Use This Page
- Sort by cost to identify the projects that drive the most spend
- Detect anomalies using the cost chart, or set up an alert to catch them automatically
- Break down by Optimization Coverage to find spend that isn't routed through Yuki, then drill into the project and its users to close the gap
Next Step
Track query speed and workload trends in the Performance page.