Welcome to Yuki
Yuki is the Contextual Execution Layer for Data Platforms - the missing layer between your data consumers and your compute. It matches every query to the right resource, automatically, before it runs - without any code changes or manual tuning. It works by analyzing metadata, which means setup is safe, lightweight, and requires zero engineering effort.
What Yuki Does
Modern data teams spend significant time and budget managing cloud compute. Yuki automates the optimization layer and integrates directly with your data platform using metadata APIs - with no query interception and no access to your data. It continuously:
- Monitors query and resource metadata to understand workload behavior - including query history, execution time, and resource utilization
- Detects inefficiencies in resource sizing, runtime, and cost consumption
- Automatically adjusts compute resources and routes queries to the most suitable place based on observed workload patterns
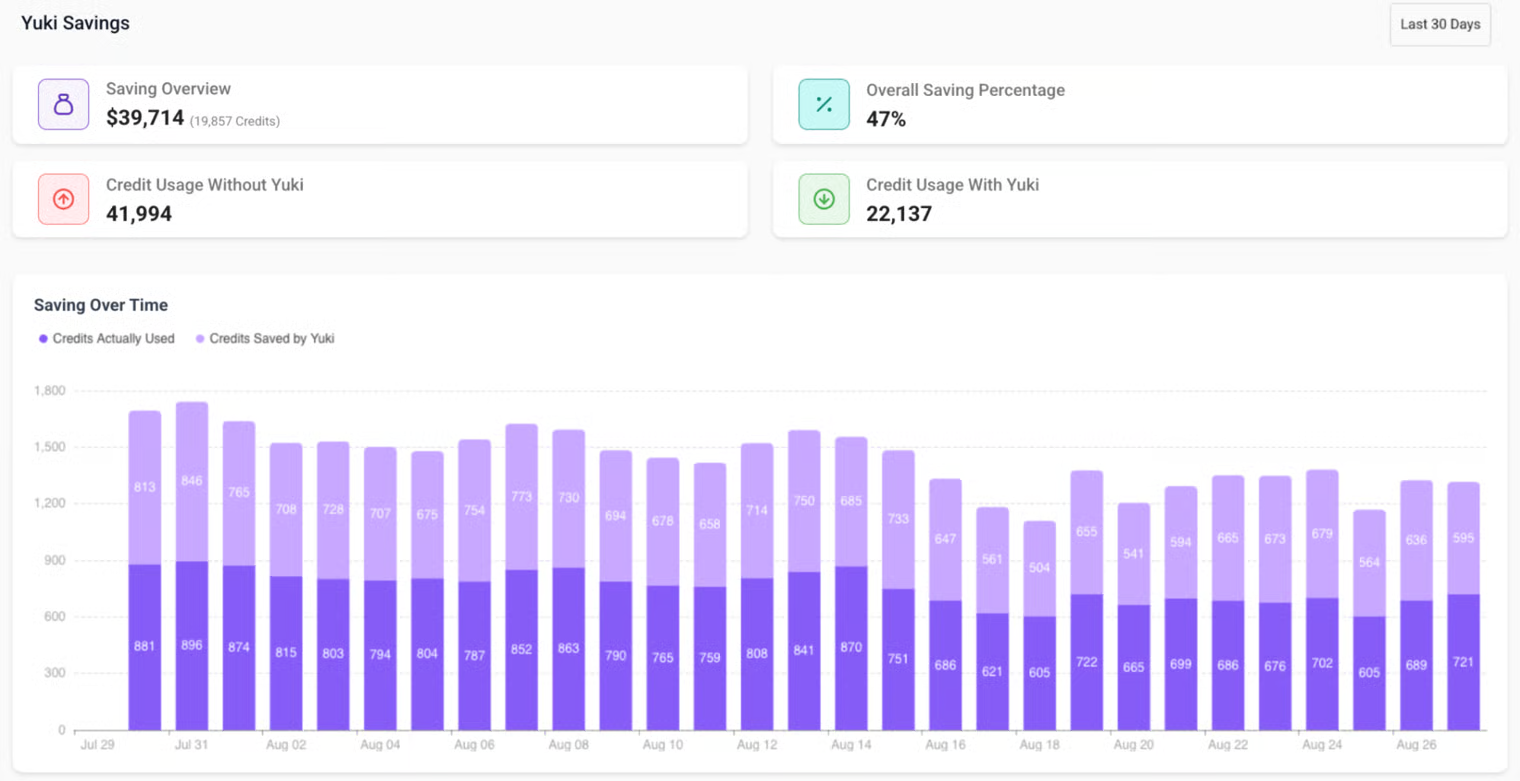
The result: lower spend, faster queries, and full visibility into compute usage.
Because Yuki operates purely on metadata, there's:
- No code modification
- No change to user behavior or query paths
- No data exfiltration risk
Deployment Types
Yuki can be deployed in two modes depending on your data residency and security requirements:
1. Full SaaS
Yuki hosts and manages the full optimization layer. You simply connect your data platform account using a service user and key-pair authentication. No infrastructure setup, no maintenance - you start optimizing within minutes.
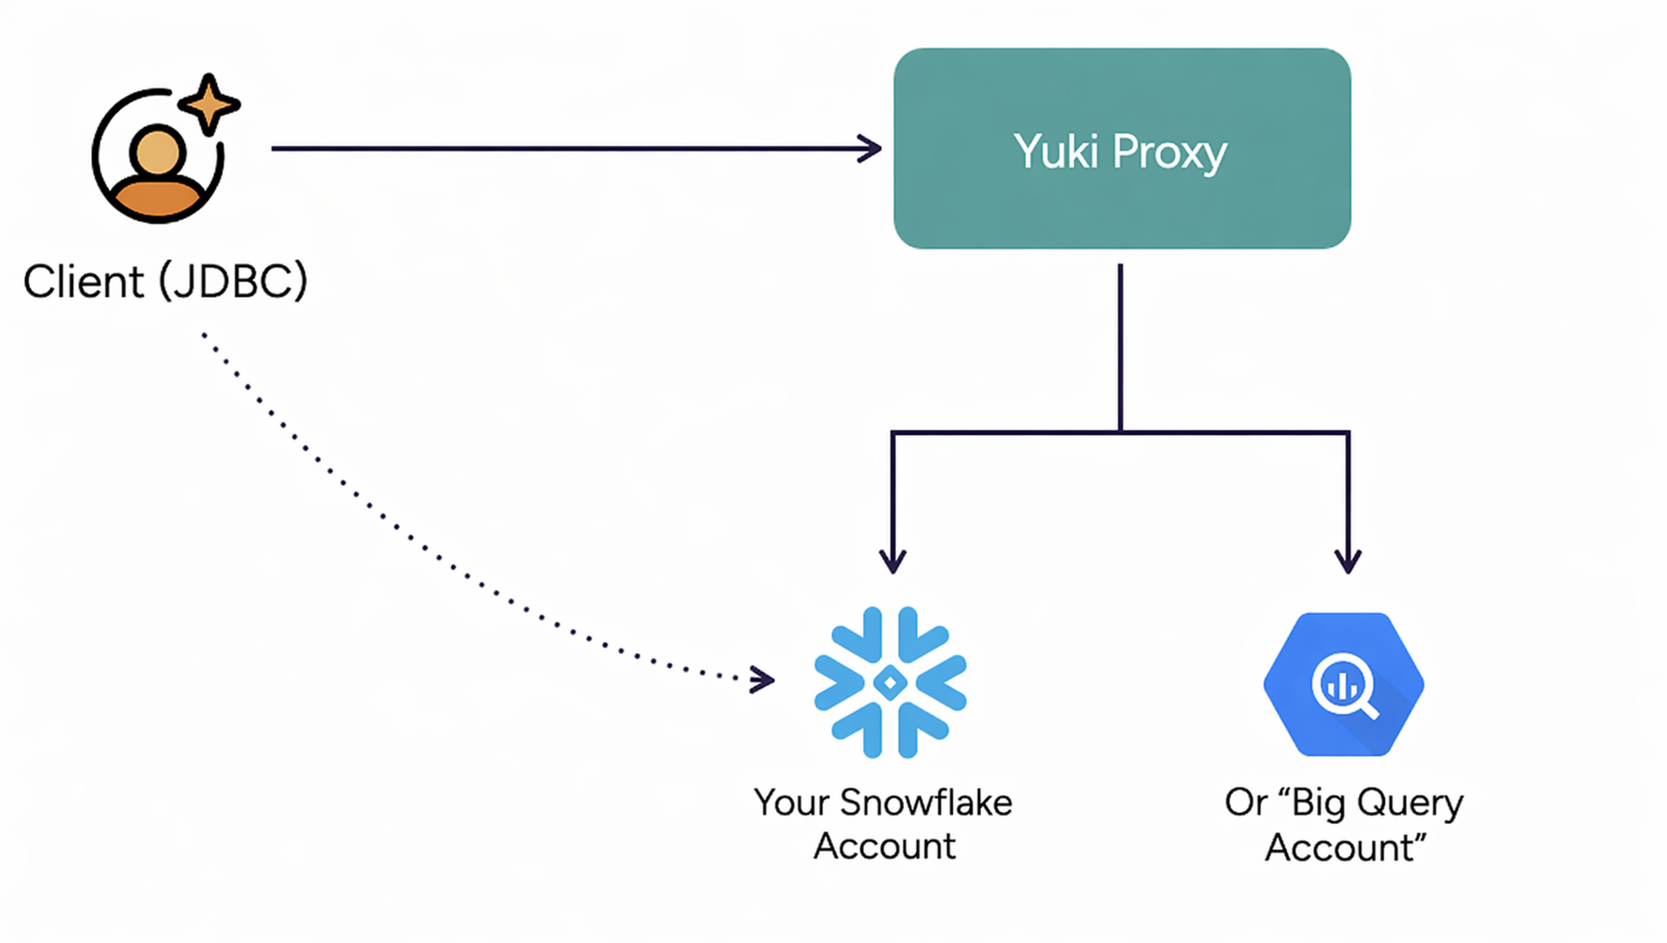
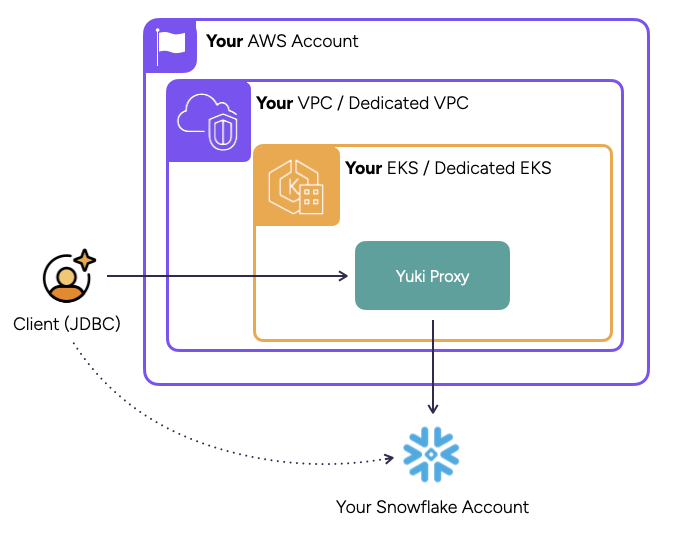
2. Hybrid Deployment
Available now for Snowflake - with BigQuery coming soon. For organizations that require processing within their own VPC or that have strict data residency requirements. You deploy the Yuki Proxy inside your environment via Helm Chart or Terraform. In this setup, Yuki runs entirely inside your environment, forwarding only optimization metadata over HTTPS to the Yuki Engine.
Metadata-Only by Design
Yuki never reads or copies customer data - only system metadata such as:
- Query IDs, timestamps, and runtime
- Resource sizes and cost consumption
- Execution statistics
Security and Isolation
- No data access - Yuki only reads platform metadata tables (system tables and usage views)
- Secure connection - authentication via service user and key-pair
- Optional Hybrid mode - run Yuki Proxy inside your environment to keep all metadata local