Performance
The Performance page gives you a complete view of how your BigQuery workload behaves over time - execution speed, data processing patterns, and slot consumption.
Performance KPIs
At the top, three cards compare yesterday against a rolling baseline, so you can spot a sudden change at a glance. Choose the baseline with Rolling 7 Days or Rolling 30 Days.
| KPI | What it compares |
|---|---|
| Execution Time | Yesterday's average query execution time vs. the baseline |
| Data Scanned | Yesterday's GB scanned vs. the daily average for the baseline |
| Slot Usage | Yesterday's average slot usage vs. the daily average for the baseline |
An increase is shown in red with an up arrow, and a decrease in green with a down arrow - The cards follow the Projects Selection filter below.
1. Query Volume & Performance
Focuses on the speed of your BigQuery workload.
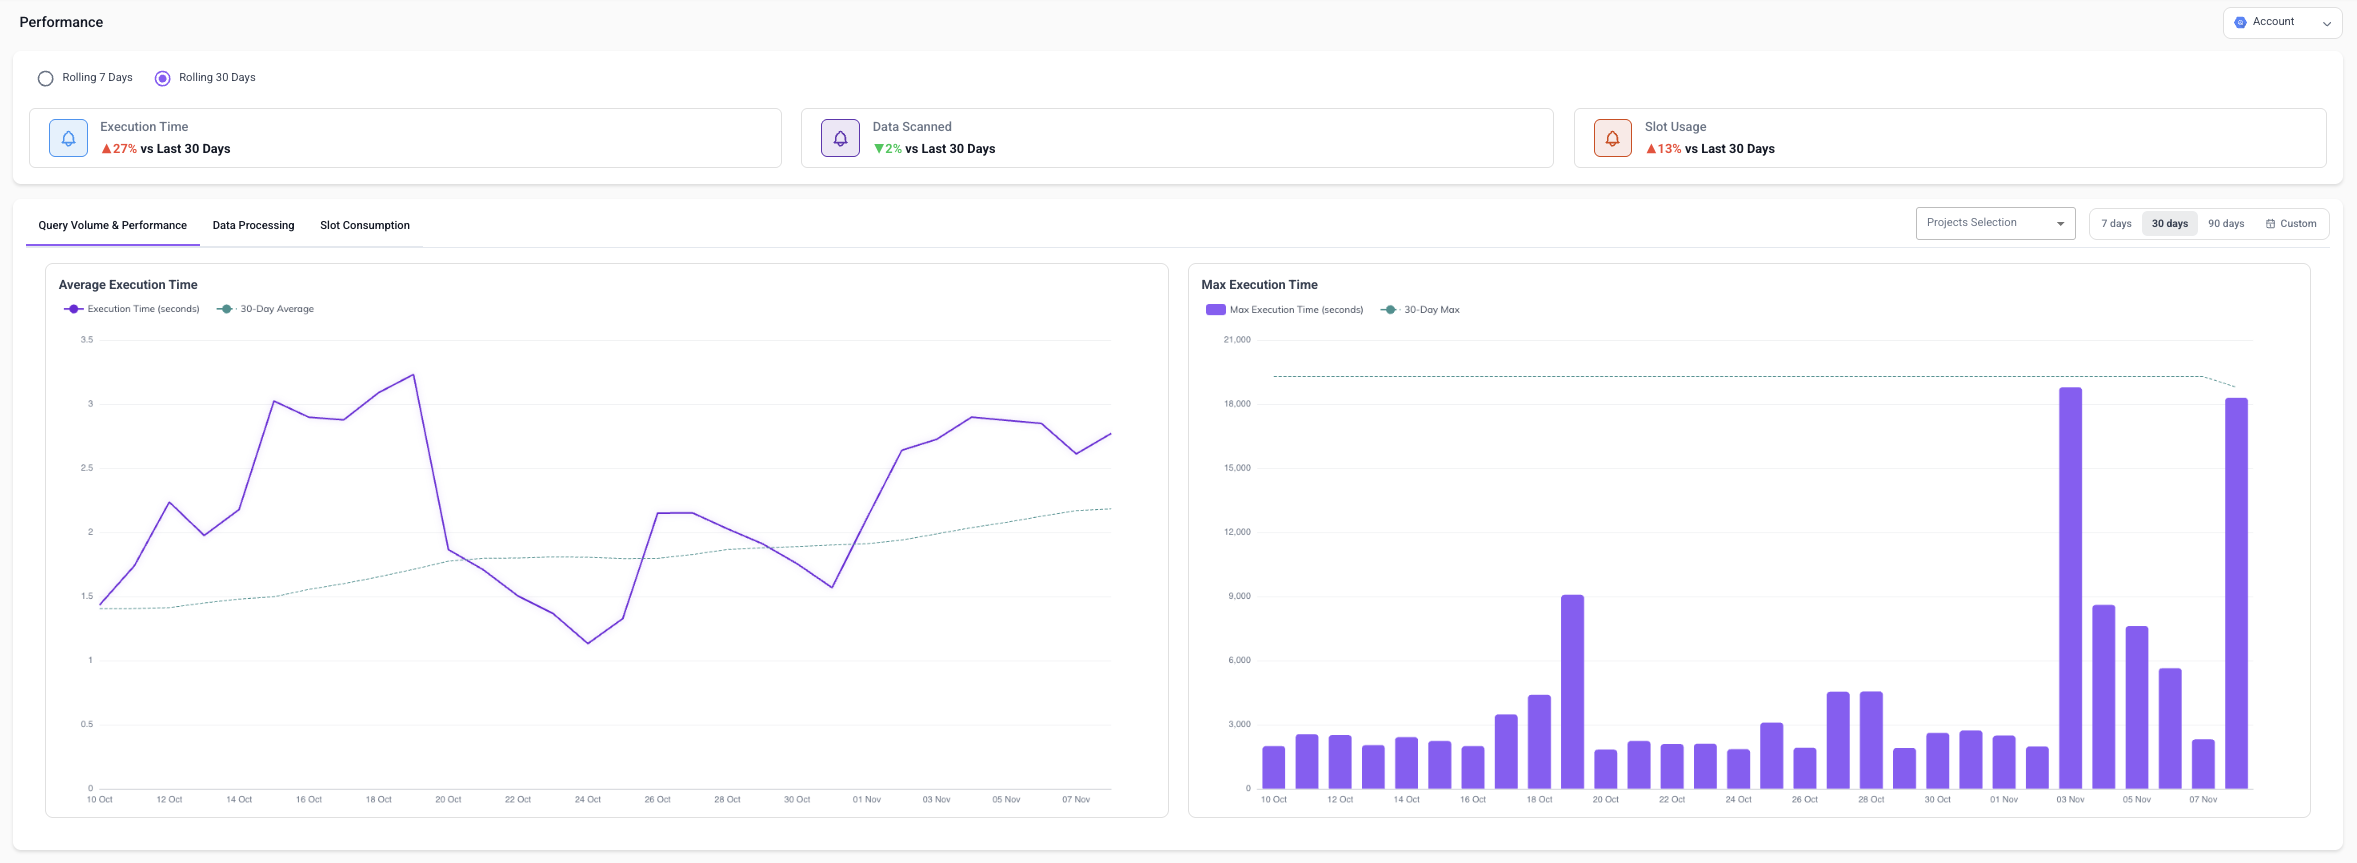
Average Execution Time
- Track average daily execution time (in seconds) vs. a rolling 30-day average
- Identify slowdowns, spikes, or trends
- Validate improvements after query changes or enabling optimization
Max Execution Time
- Identify inefficient logic, large scans, or bad joins
- Compare the longest-running query each day to the 30-day max
- Spot regressions after ETL or dbt changes
2. Data Processing
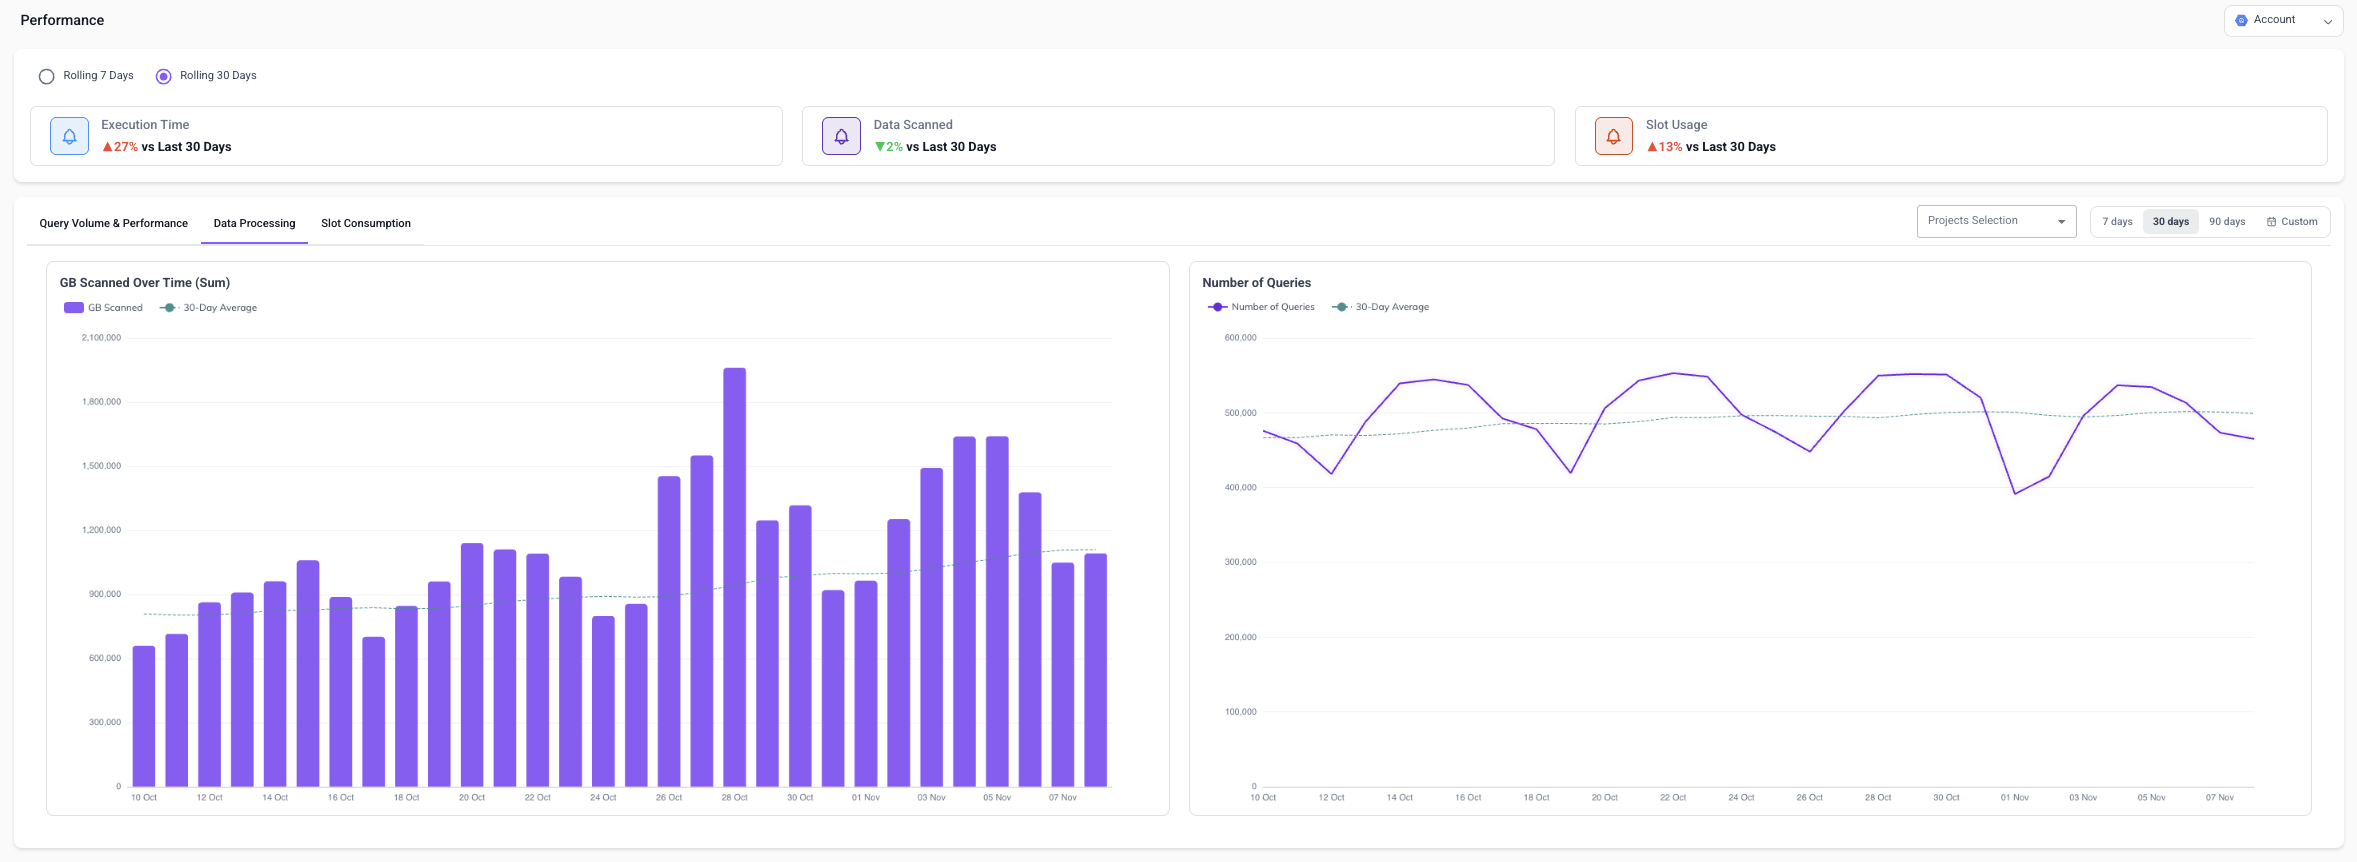
Explains how much data your queries process, which directly influences cost and performance.
GB Scanned Over Time (Sum) - daily total GB scanned across all queries, overlaid with the 30-day average.
Number of Queries - daily query count vs. the 30-day average. Use it to detect usage spikes or drops and correlate workload changes with changes in data scanned.
3. Slot Consumption
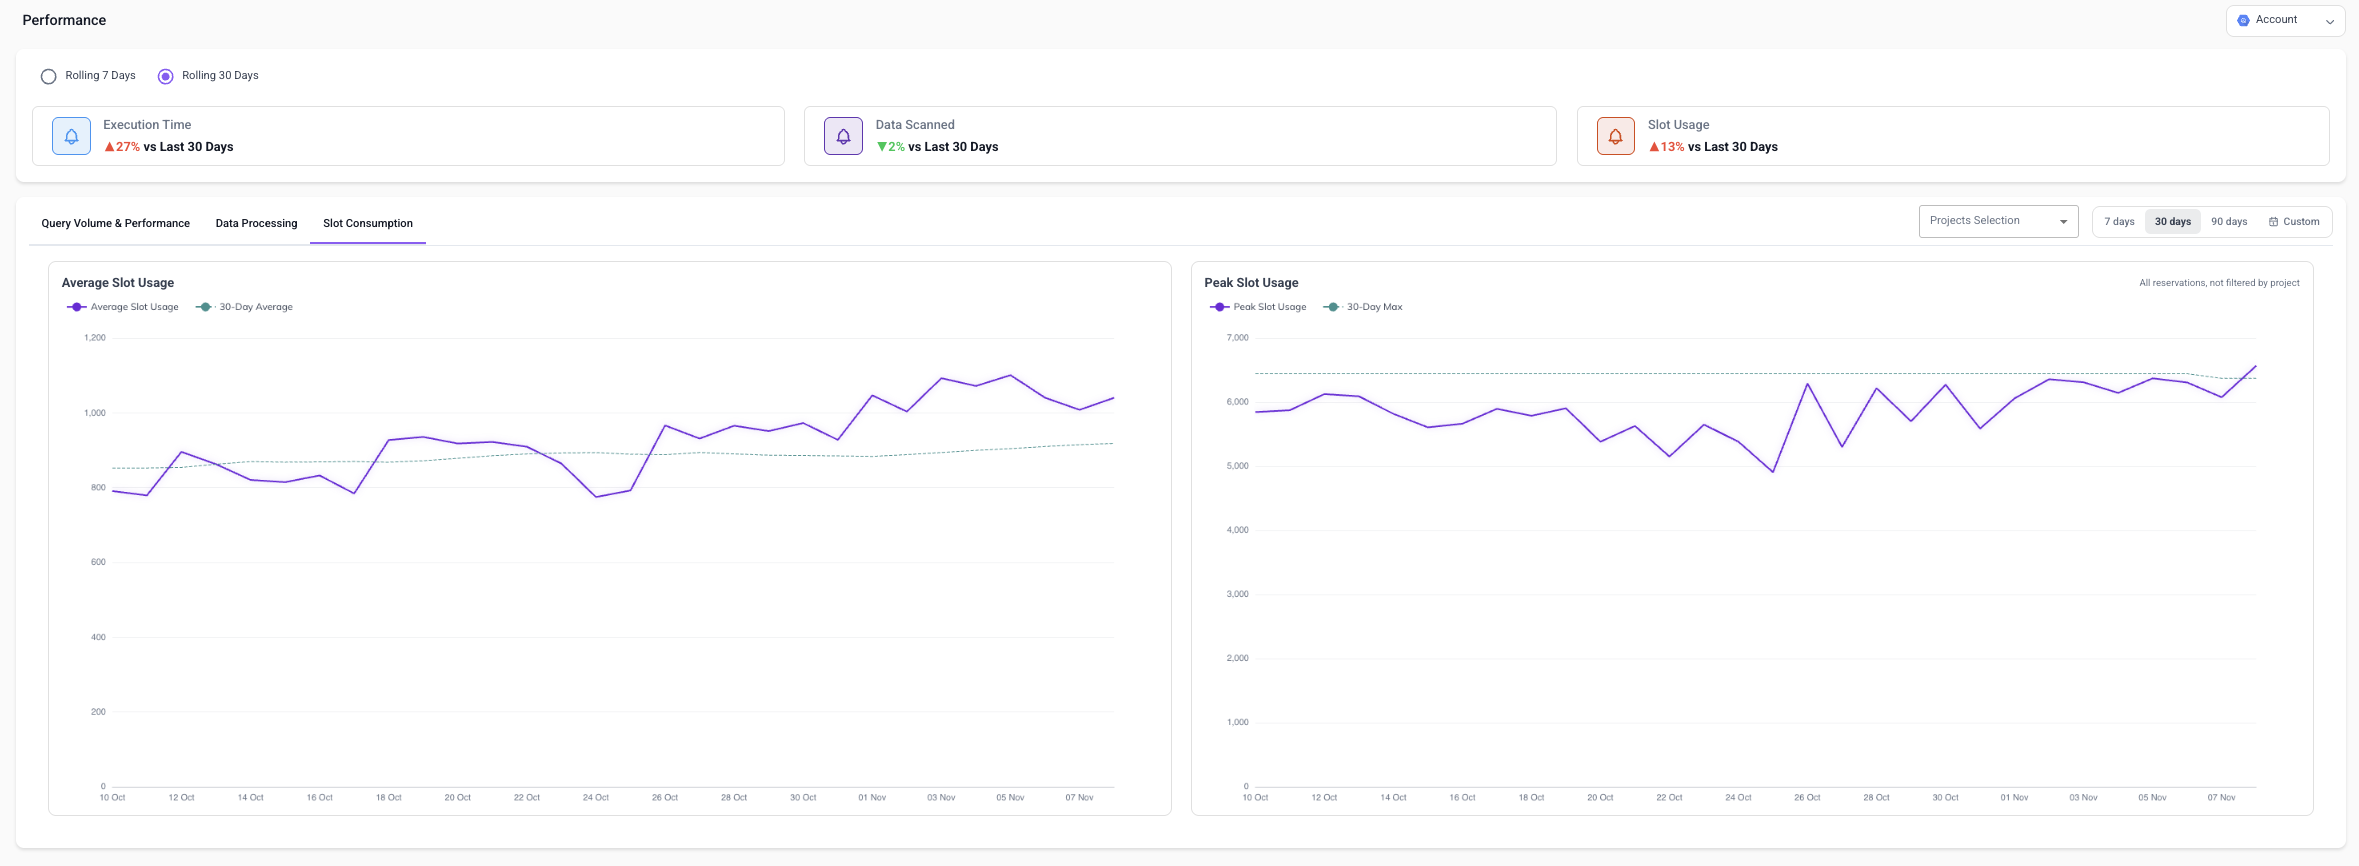
Shows how much compute capacity your workload uses.
Average Slot Usage - the average number of slots in use each day, vs. the 30-day average.
Peak Slot Usage - the highest slot usage each day, vs. the 30-day max. This chart covers all your reservations and isn't filtered by project. It's shown only if you use reservations.
Date Controls & Project Filtering
- Choose 7 days, 30 days, 90 days, or a Custom range to explore trends over time
- Use Projects Selection to isolate the performance of specific projects
- Use the Account selector (top right) to switch between connected BigQuery accounts
How to Use This Page
Detect a slowdown: Watch the KPI cards for a jump in execution time, then check Max Execution Time to see whether a few long-running queries are driving it.
Validate optimization impact: Compare execution time and slot usage before and after enabling Yuki on a project.
Diagnose cost inefficiency: Analyze GB scanned and slot usage trends and correlate spikes with job, ETL, or dbt activity.