Cortex Dashboard
Cortex spend comes from agents, direct inference, SQL functions, search, and coding tools - all billed from one credit pool. This dashboard shows where it's going, who's driving it, and how it's performing, in one page.
Page Overview
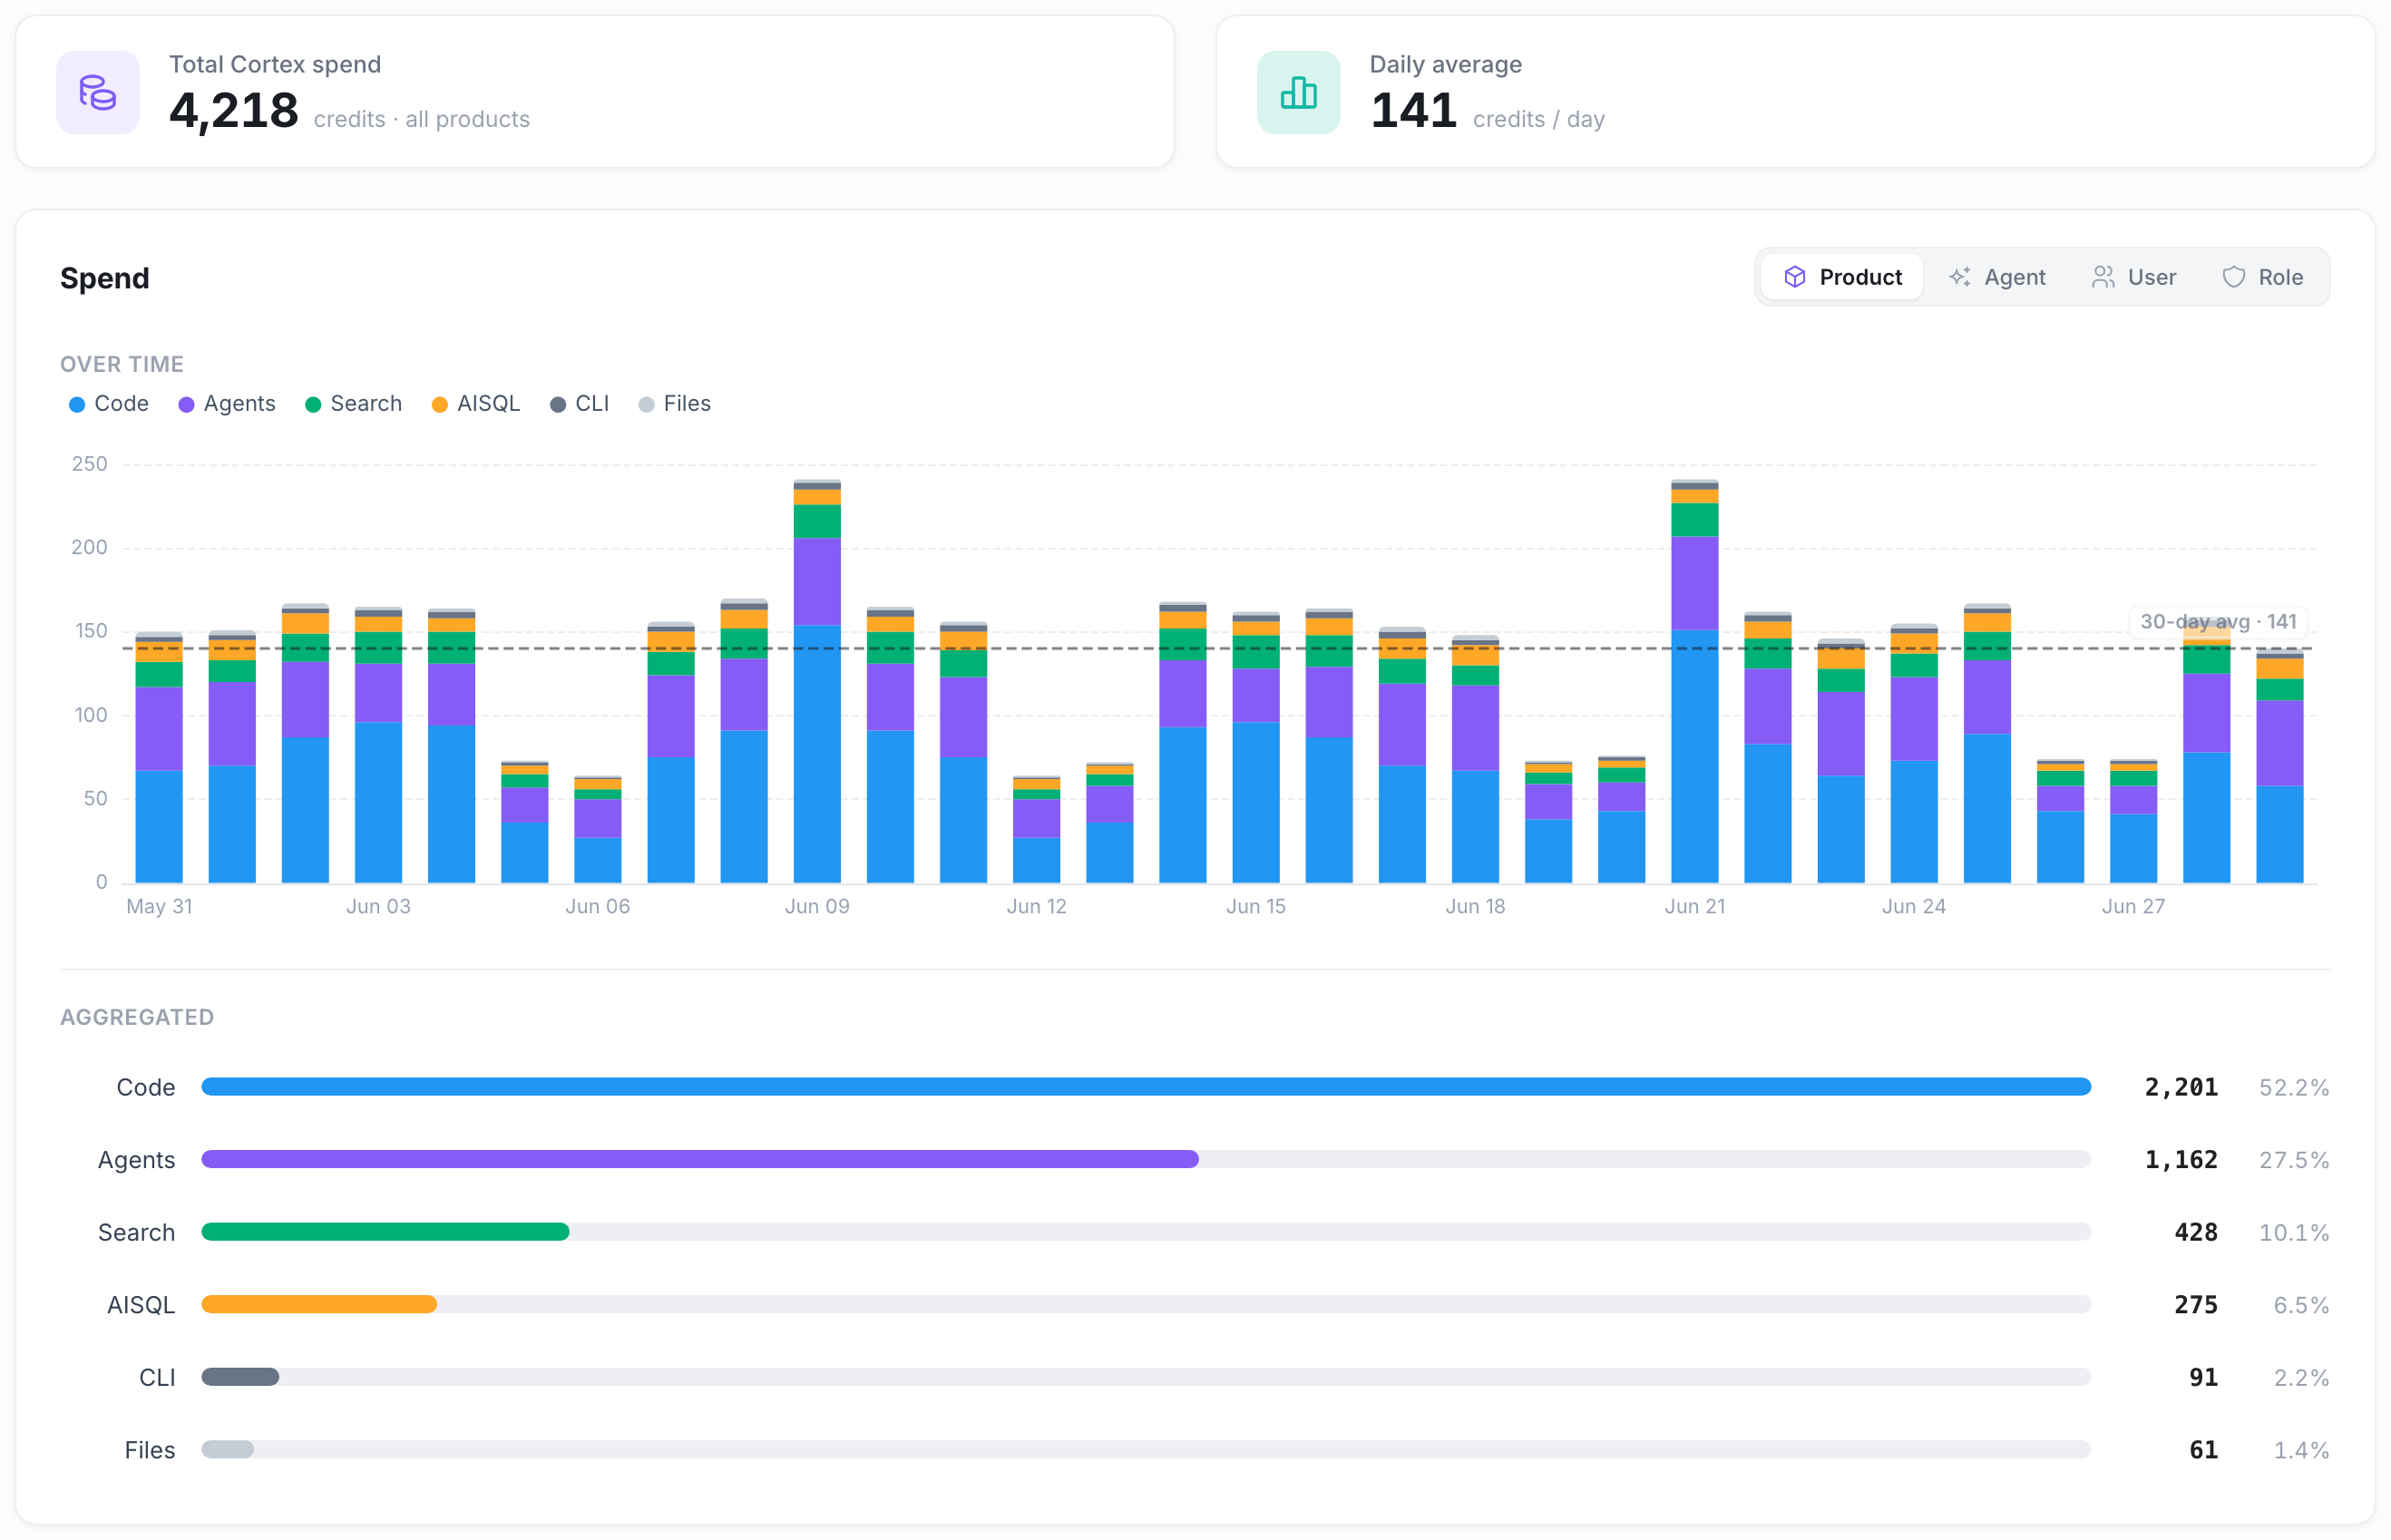
At the top, two summary cards:
- Total Cortex Spend - total credits consumed across all Cortex products in the selected period
- Daily Average - average credits burned per day
Use the date range selectors (top right) to adjust the view.
Spend Over Time
A stacked bar chart showing daily Cortex spend:
- Switch the breakdown between Product, Agent, User, or Role to drill into who or what is driving spend
- The dashed line marks the 30-day average, so spikes are easy to spot at a glance
- The Aggregated bars below the chart summarize total credits and % share per product for the selected period
Model Performance & True Cost
Two tables break down cost and latency per model:
| Table | Description |
|---|---|
| Spend per model | Queries, the token/compute credit split, token credits, compute credits, and total credits per model |
| Model latency | P50, P95, and P99 response latency per model and function, sortable by percentile |
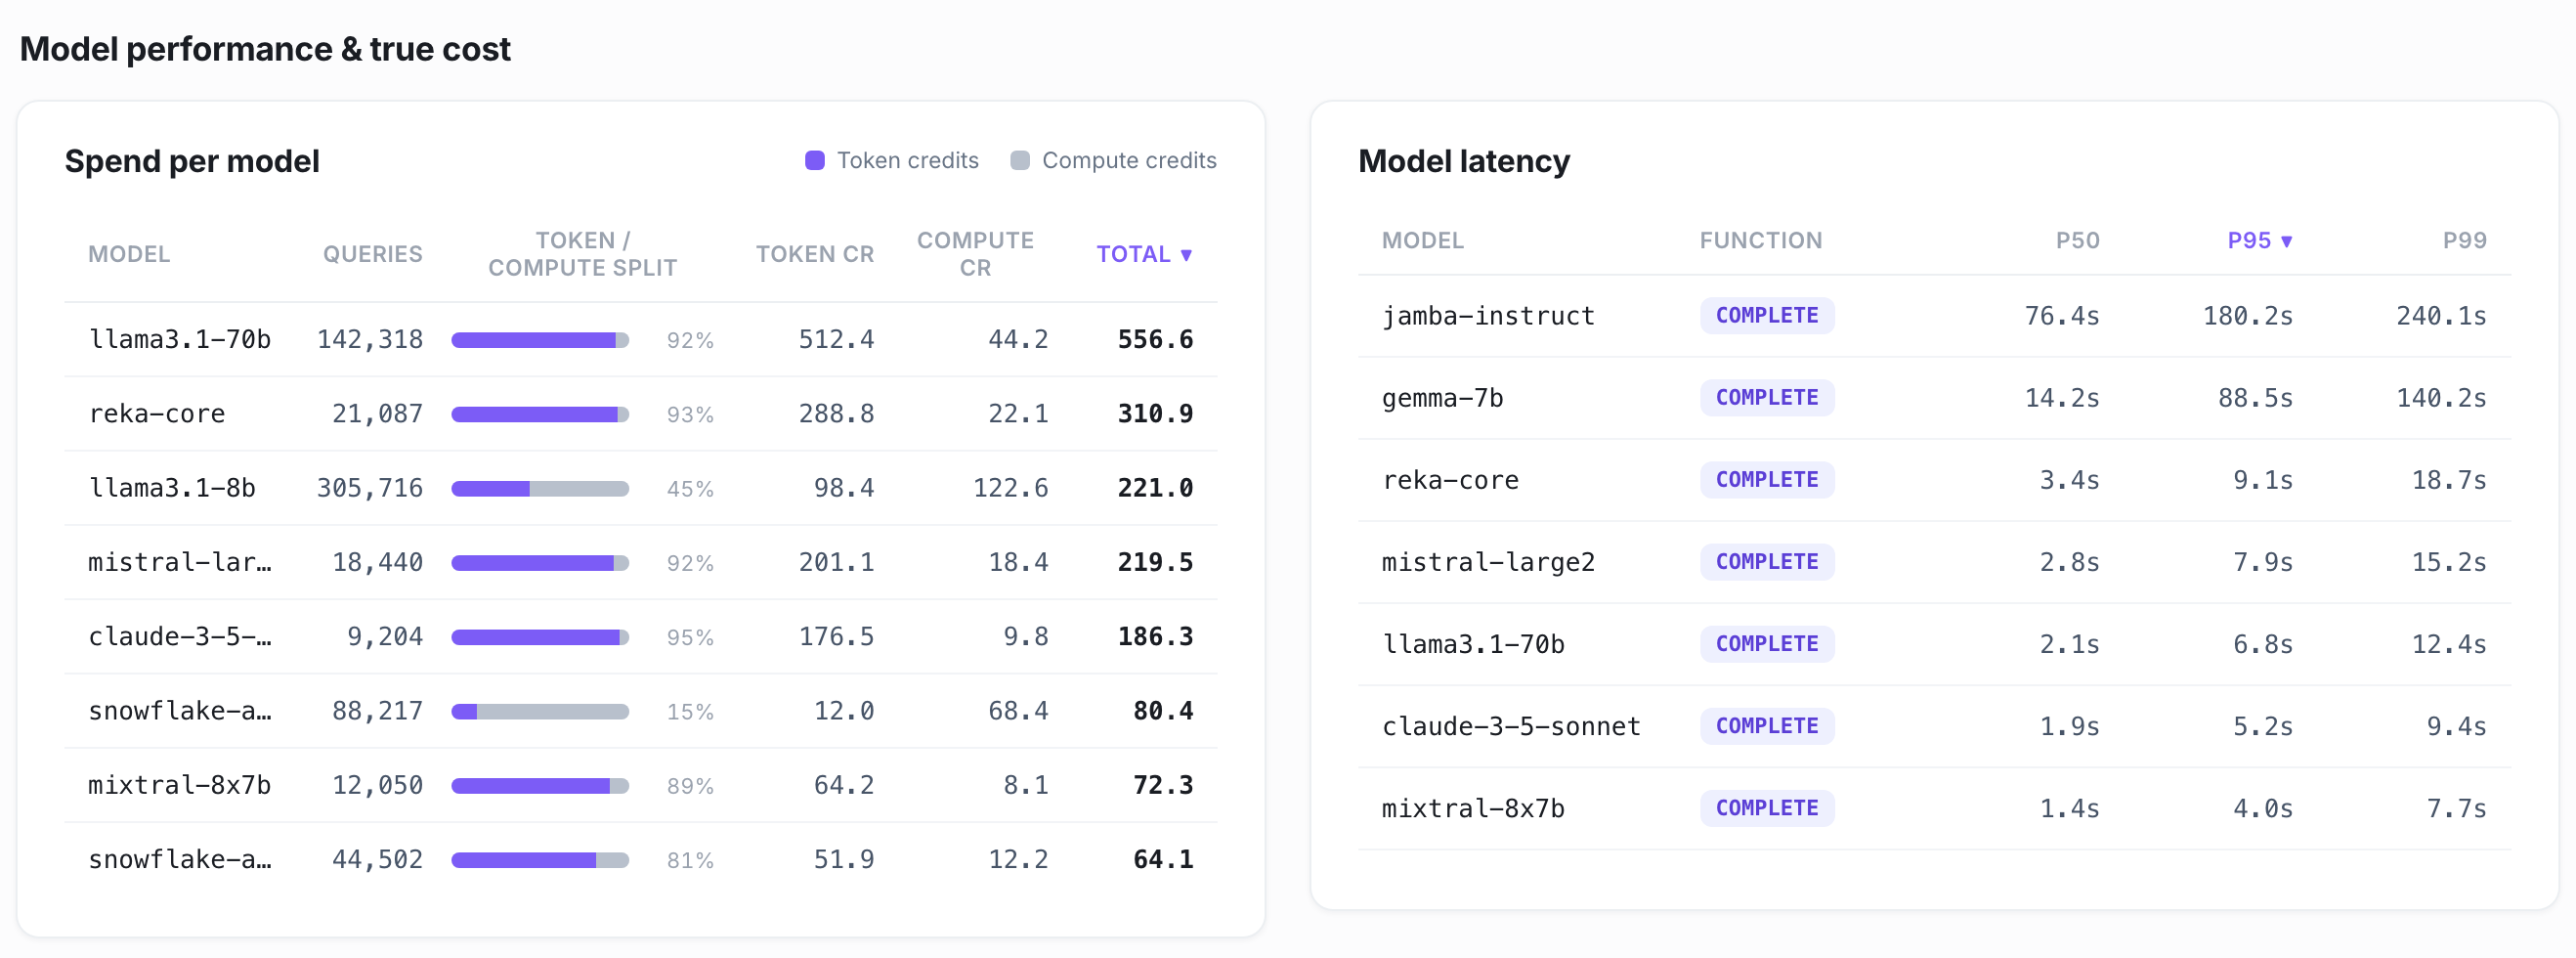
Use this to tell whether a cost or performance issue comes from model selection, prompt complexity, or infrastructure latency, rather than just seeing an aggregate cost go up.
Cost Alerts
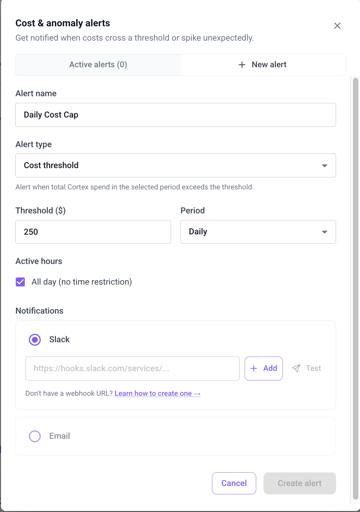
Set up alerts so you don't have to watch the dashboard to catch a spend spike. Open New alert from the alerts panel to configure one:
- Alert name - a label to identify the alert (e.g. "Daily Cost Cap")
- Alert type:
- Cost threshold - fires when total Cortex spend in the selected period exceeds a set amount
- Cost anomaly - fires on unexpected Cortex spend spikes
- Threshold ($) and Period - the dollar amount and time window (e.g. Daily) the threshold applies to
- Active hours - restrict the alert to specific hours, or leave it set to all day
- Notifications - deliver the alert via Slack (paste an incoming webhook URL and send a test message) or Email
Active alerts are listed under the Active alerts tab, with a count of how many are currently configured.
How to Use This Page
- Spot spend spikes on the Spend Over Time chart, then switch to Agent or User to trace the spike to its source
- Compare model efficiency using the token/compute split - a low token share means a model is compute-bound rather than token-bound
- Diagnose slow responses by sorting Model Latency by P95 or P99 instead of only looking at aggregate cost
- Get proactive alerts by setting a cost threshold or anomaly alert so spend spikes reach you in Slack or email instead of being caught after the fact