Savings
The Savings page provides visibility into Yuki's impact on Snowflake spending by comparing credit usage with and without optimization enabled.
Page Overview
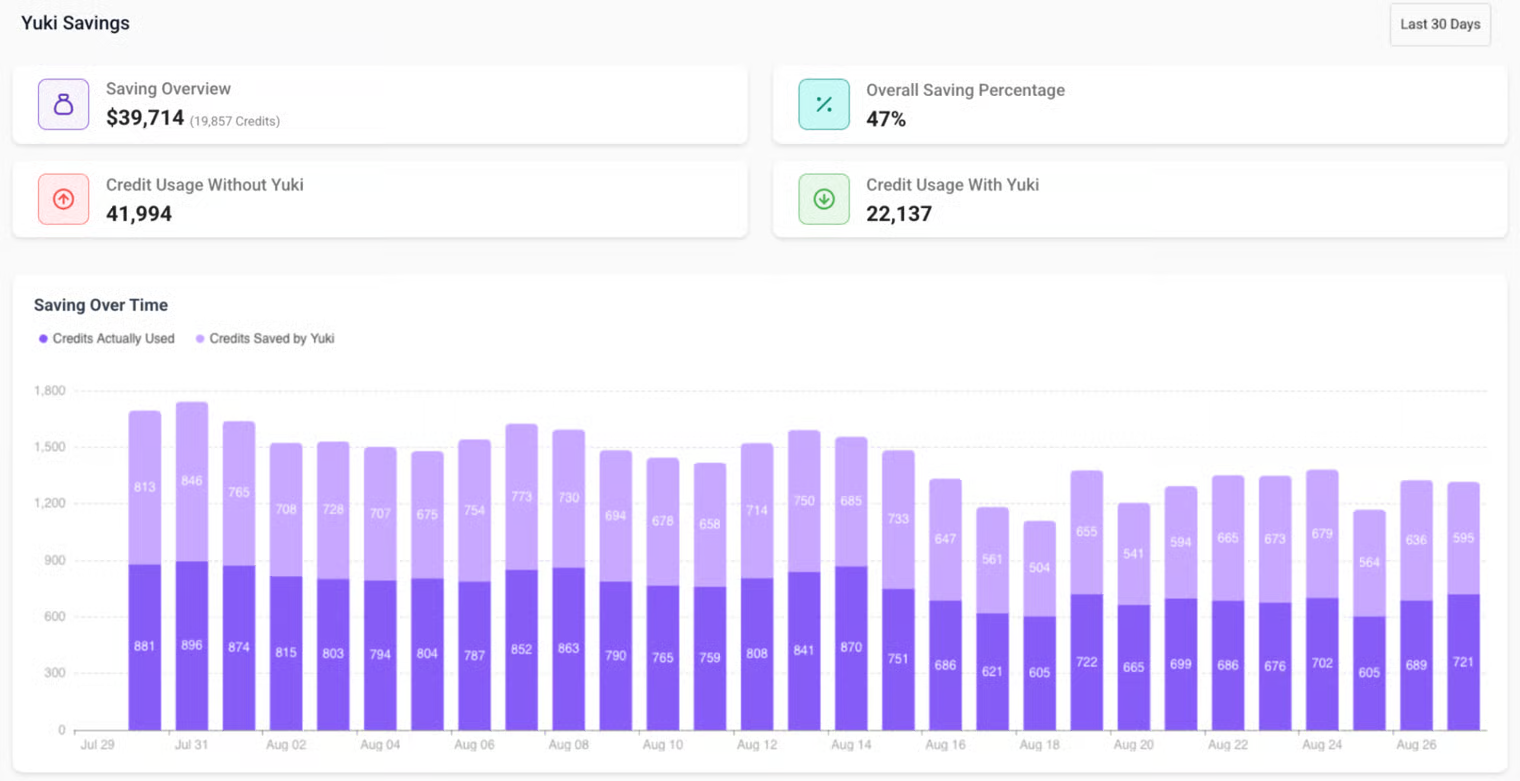
The top section displays four essential metrics:
| Metric | Description |
|---|---|
| Saving Overview | Total savings achieved (dollars and credits) for the selected time range |
| Overall Saving Percentage | Percentage reduction in credits or cost achieved through Yuki optimization |
| Credit Usage Without Yuki | How many credits would have been consumed without Yuki |
| Credit Usage With Yuki | Actual credits used with Yuki optimization active |
Use the time range selector (top right) to adjust the view.
Saving Over Time Chart
The main chart visualizes daily credit usage and credits saved:
- Darker bars - credits actually used
- Lighter (upper) bars - credits saved by Yuki
- Hover over any day to view exact numbers
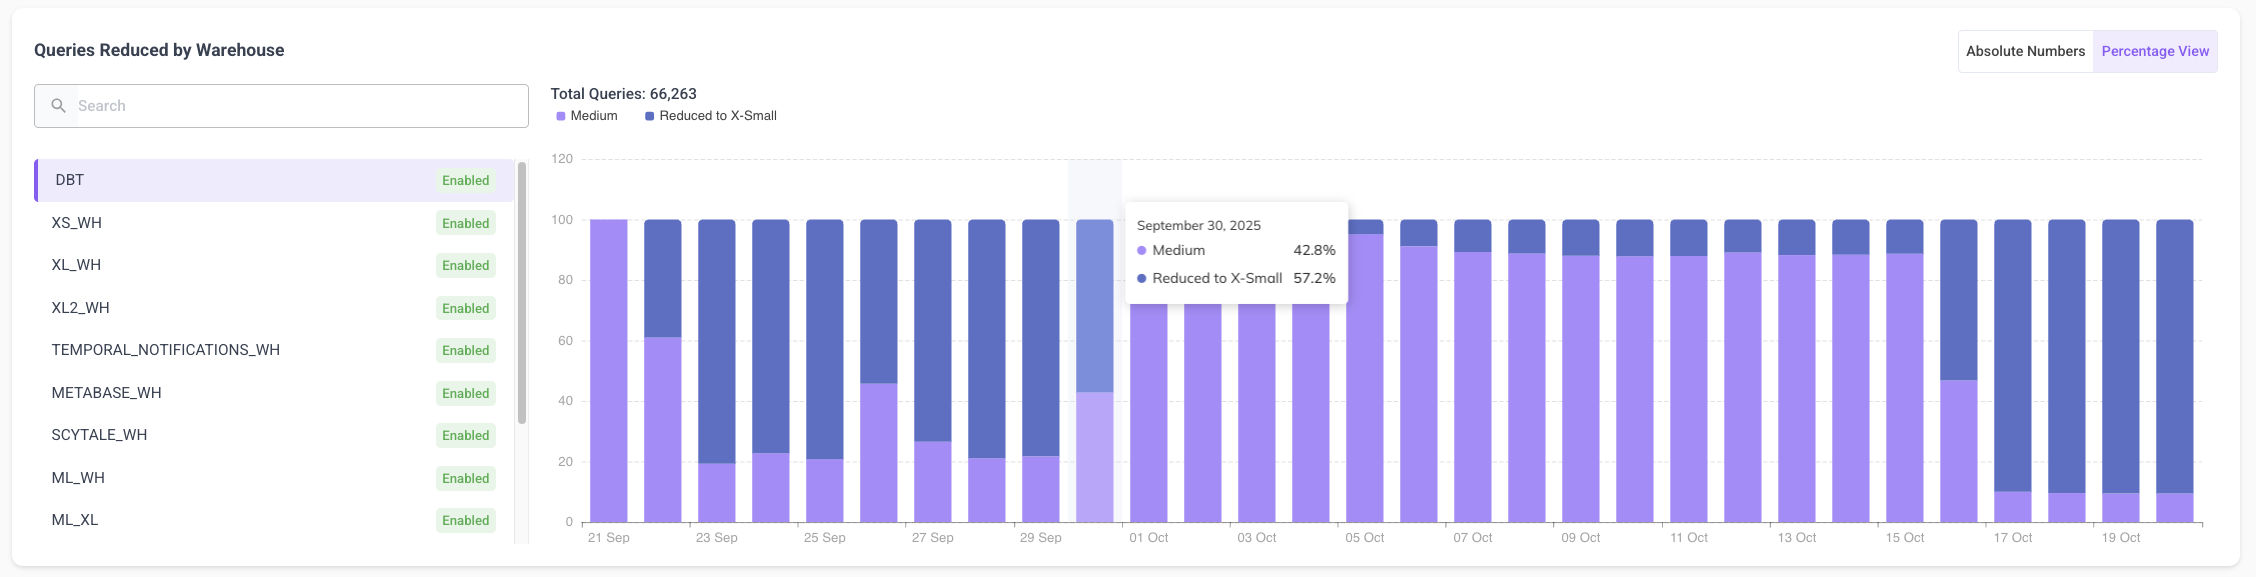
Queries Reduced by Warehouse
This section shows how Yuki dynamically resized queries across each warehouse:
- Each bar shows how queries were automatically routed to smaller warehouse sizes without performance degradation
- Darker segments - queries reduced to smaller sizes (e.g., Medium → X-Small)
- Lighter segments - unchanged workloads
- Use the search bar to locate a specific warehouse
- Toggle between Absolute Numbers and Percentage View
How to Use This Page
- Validate that your Yuki setup is actively generating savings
- Track savings trends over weeks or months
- Compare with Cost Overview to see which warehouses drive the most impact