dbt
To enable this feature, complete the quick setup in Yuki's dbt integration guide.
The dbt page provides full visibility into model-level cost and performance. Track how each job ran, identify which models consumed the most time or budget, and fine-tune performance by adjusting the Snowflake warehouse used for specific models and run types.
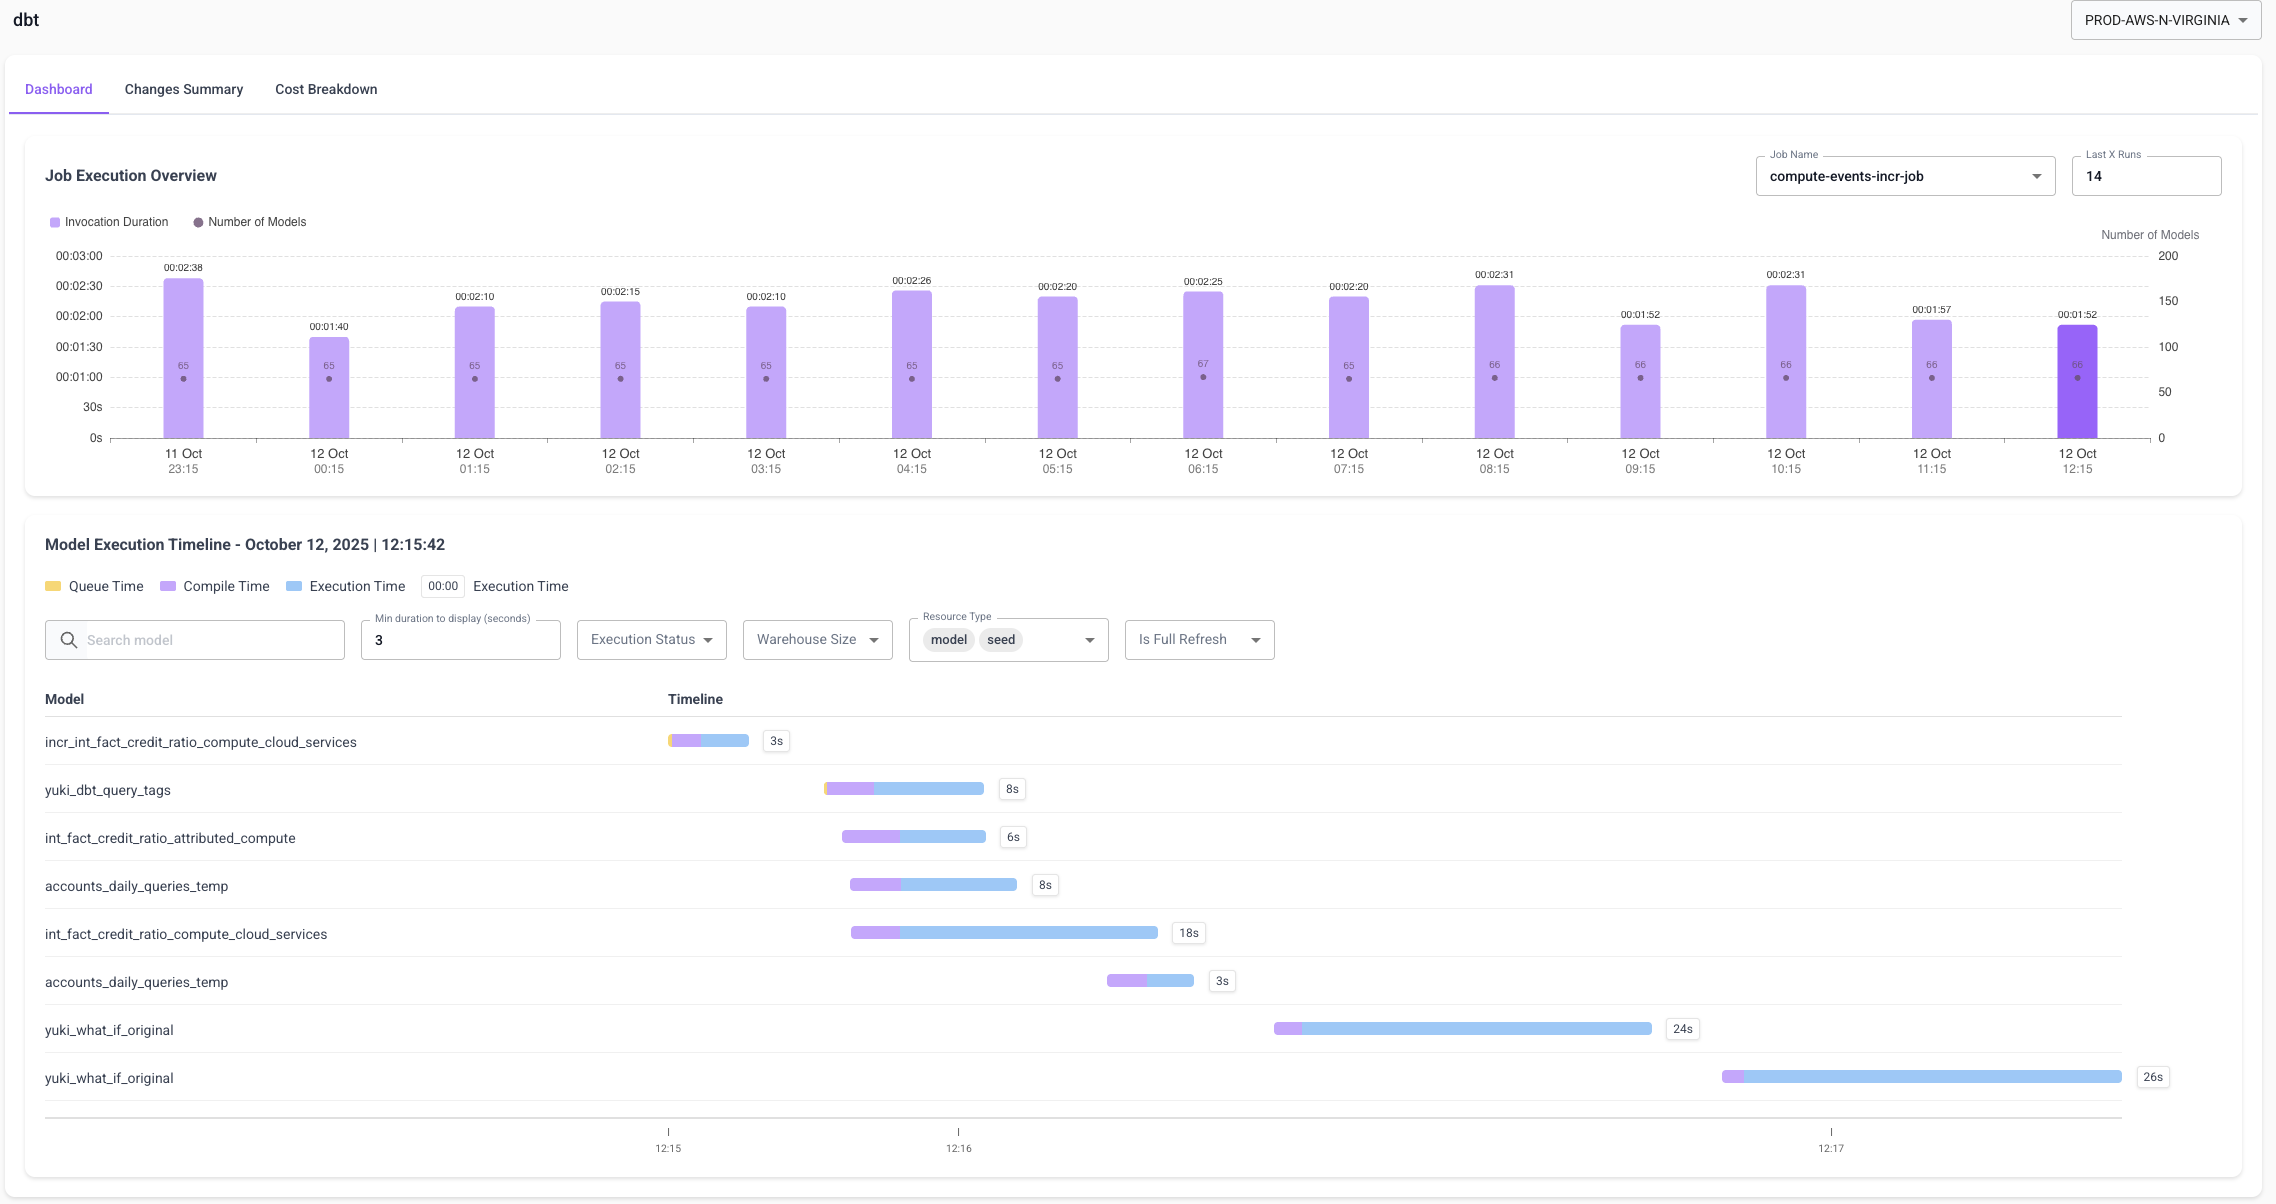
Dashboard Overview
- Execution Summary - a quick view of recent job runs with total execution time and cost. Spikes are easy to spot.
- Model Timeline (Gantt) - for any run, see what model ran when and how long it took.
- Model Drill-down - for a single model: last X runs with runtime and cost. Open the exact query in Snowflake from any row.
Filters in the top bar apply across dbt while you browse (job selection, number of last runs, status, run type, etc.).
Optimize with Model-Level Warehouse Sizing
Tune cost and performance per model, per job.
How to change a model's warehouse size:
- Open the model drill-down
- Choose the Change warehouse size tab
- Select the target size
- Apply - the change is queued for the next job
What you get back:
- Average runtime and average cost
- A Change History that records who changed what, when, and the impact (runtime/cost deltas after a few runs)
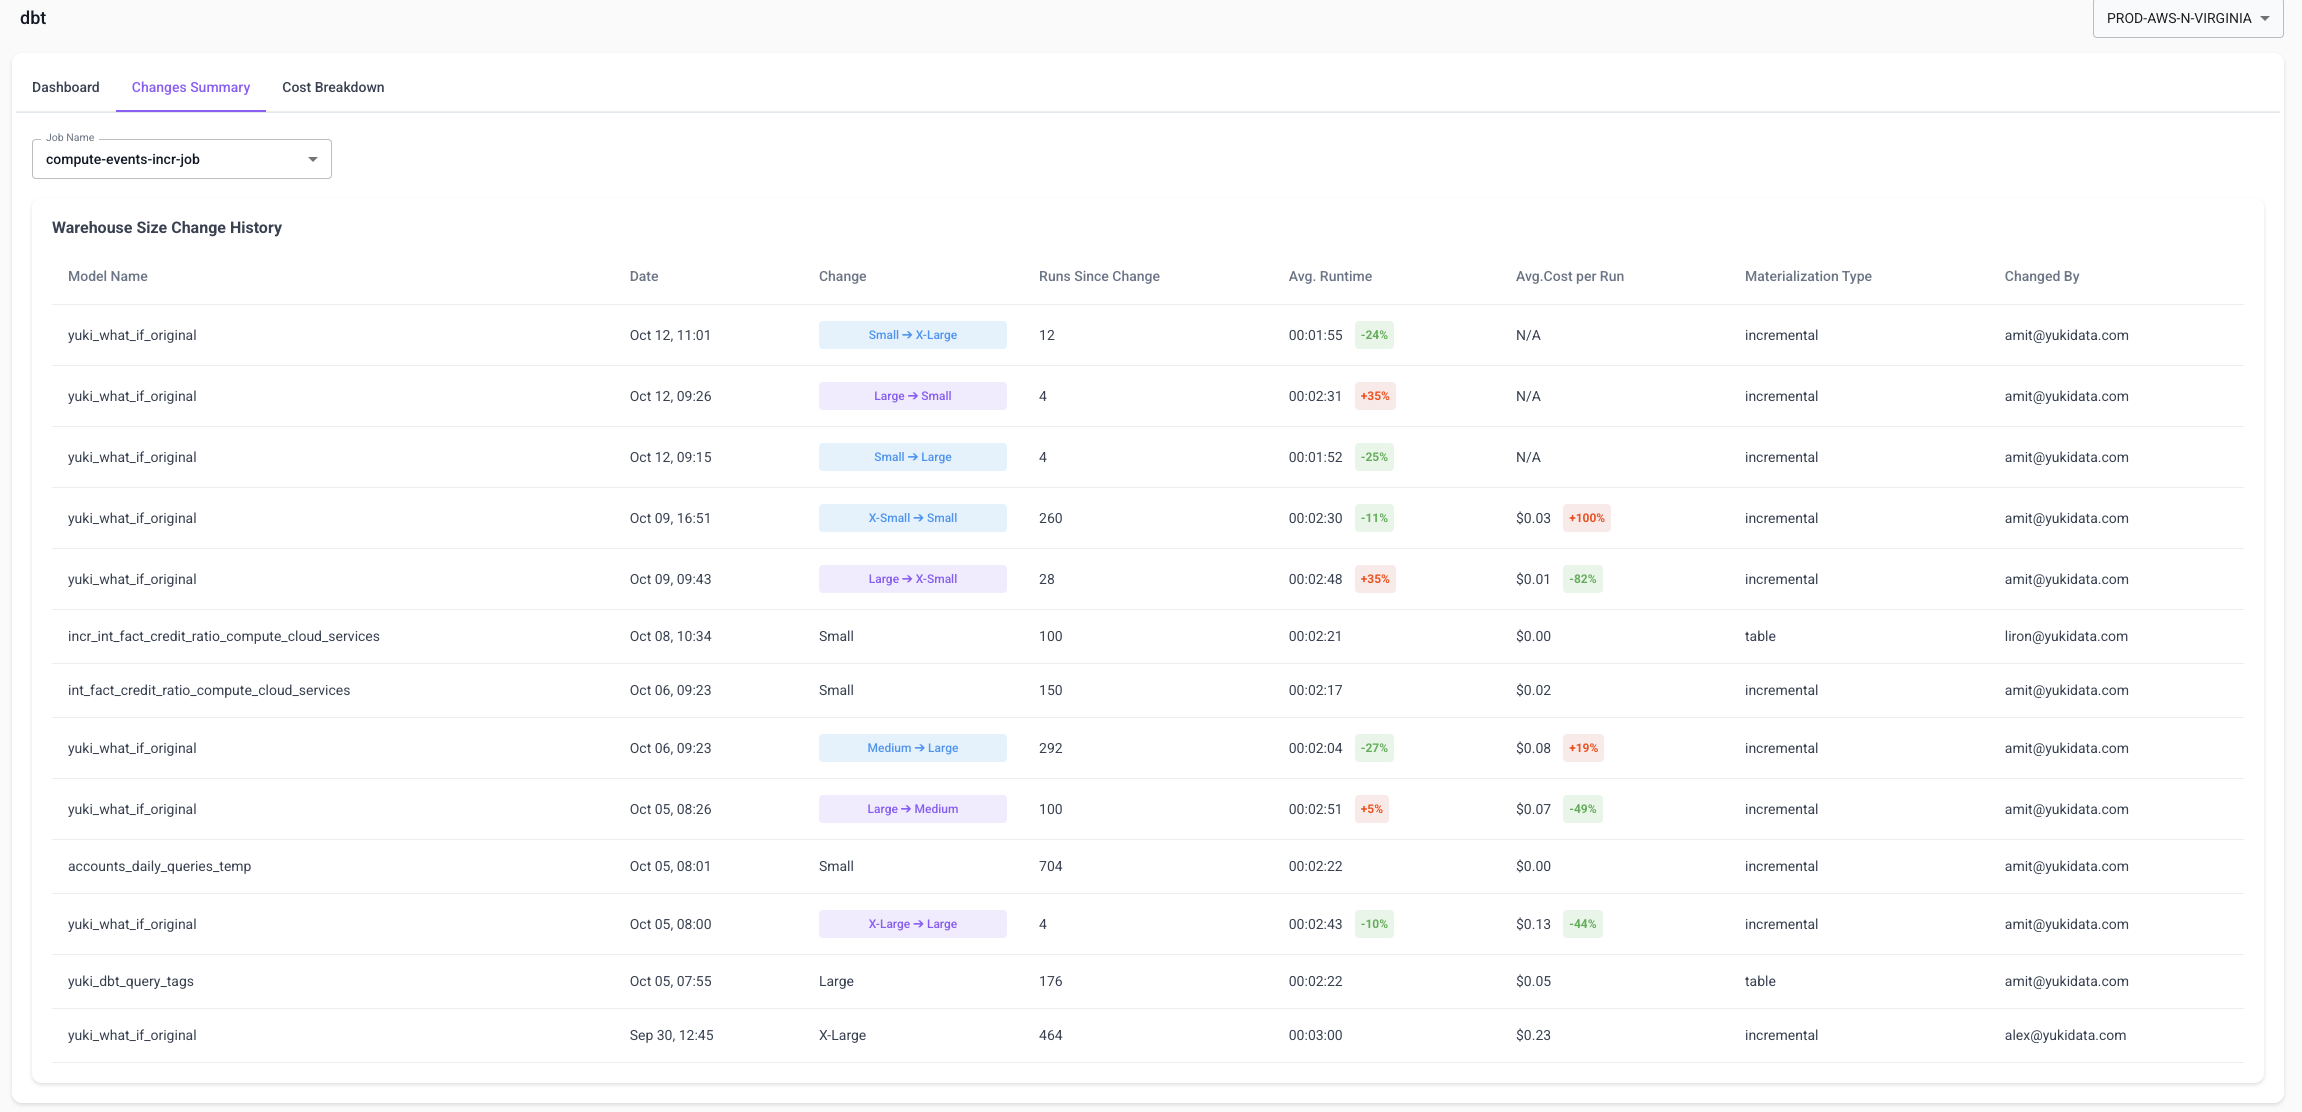
Changes Summary (Job-Level)
The Changes Summary tab centralizes all model-level warehouse size updates for a specific dbt job.
Use it to:
- Manage all model-level warehouse size adjustments in one view
- See who made each change, when it was applied, and whether it increased or decreased warehouse size
- Understand the impact - compare average runtime and cost before and after each change
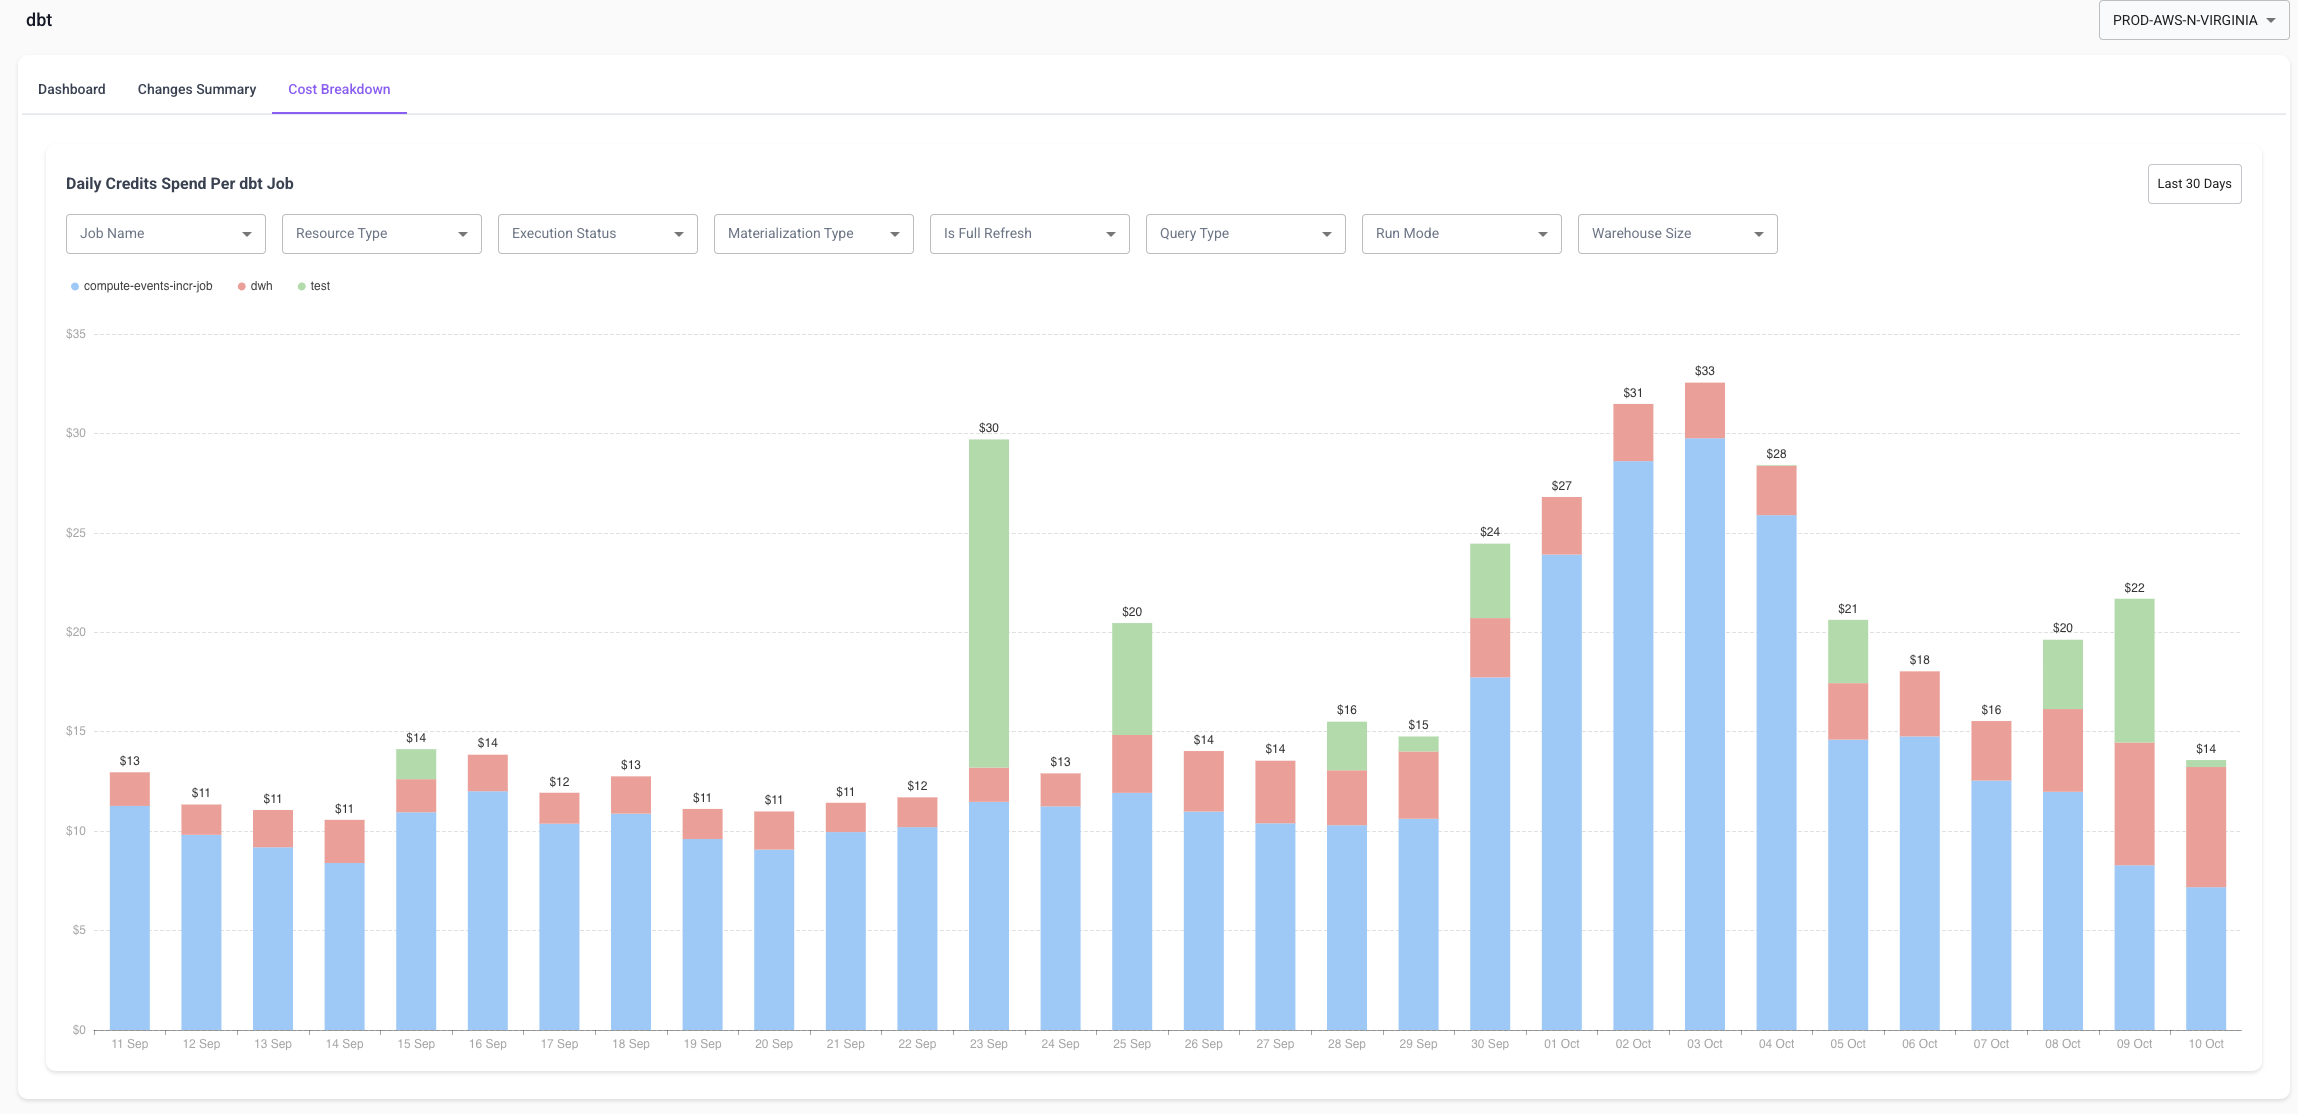
Cost Breakdown
The Cost Breakdown tab gives a clear, daily view of dbt spend.
- Stacked Daily Chart - total dbt spend per day, broken down by job
- Materialization View - compare cost across materialization types (incremental, table, view)
- User & Warehouse Filters - slice spend by users, warehouses, or domains
- Trend Indicators - spot days or jobs that deviated from normal cost behavior
Optimization Workflow
The dbt page is designed for investigate → optimize → verify loops.
Investigate a spike:
- Spot the anomaly in Execution Summary
- Open that day's Timeline to see which model took longer
- Drill down to Execution History for that model
Reduce recurring cost:
- In Changes Summary, focus on Incremental models
- Sort by cost per run
- Downsize the top offenders
- Track runtime deltas in the Change History