Cost Overview
The Cost Overview page provides a detailed view of your Snowflake credit consumption and total spend. It helps you understand where costs originate, which warehouses contribute most, and how Yuki optimization impacts daily usage trends.
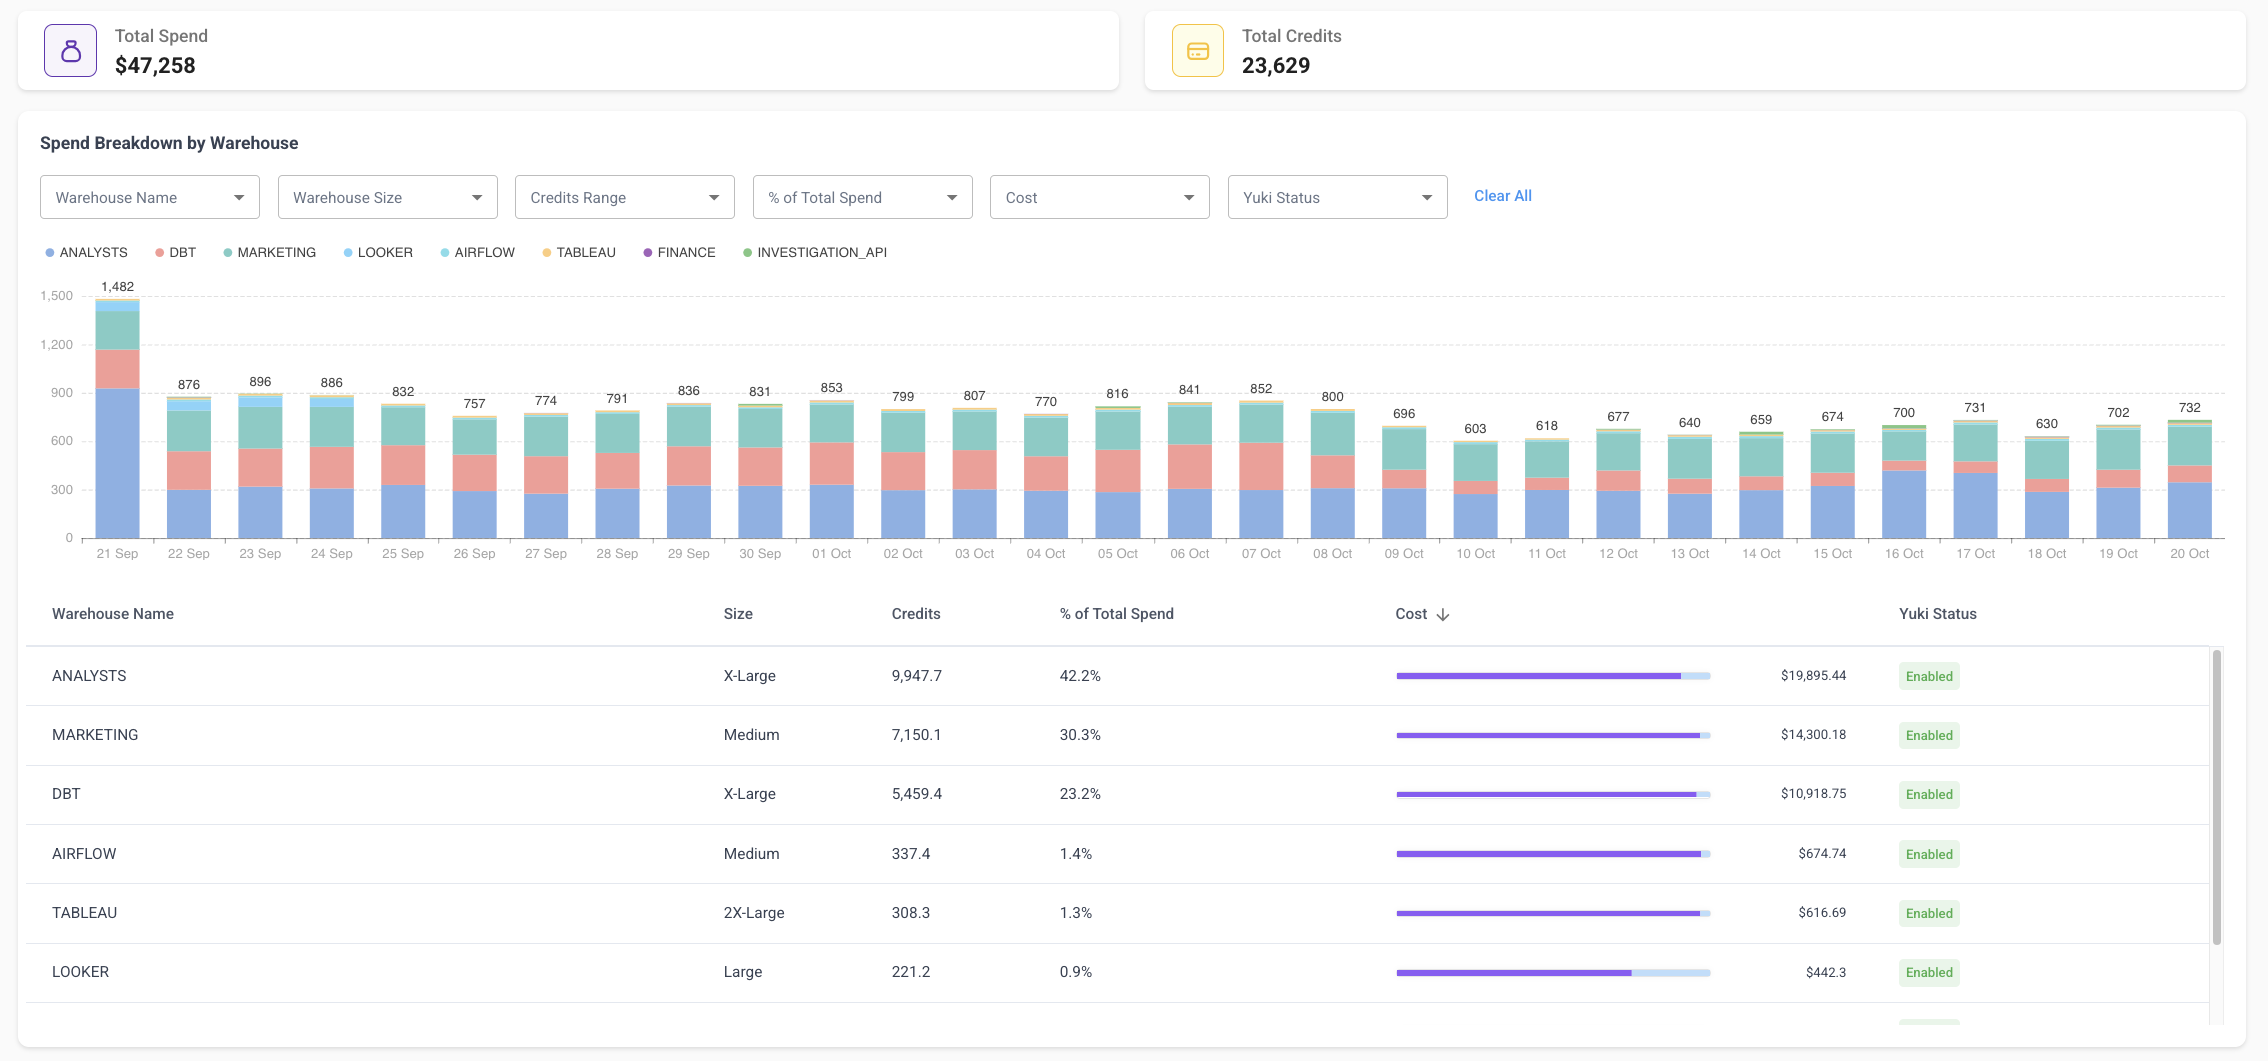
Page Overview
At the top, two summary cards:
- Total Spend - your total Snowflake cost in dollars
- Total Credits - total credits consumed during the selected period
Use the time range selector (top right) to adjust the view.
Spend Breakdown by Warehouse
A stacked bar chart showing daily cost distributed across warehouses:
- Hover over a bar to view exact credits used by each warehouse
- Filter by Warehouse Name, Warehouse Size, Credits Range, or % of Total Spend
- Check the Yuki Status box to show only warehouses currently optimized by Yuki
Warehouse Cost Table
| Column | Description |
|---|---|
| Warehouse Name | The Snowflake warehouse associated with the spend |
| Size | Configured size (e.g., Medium, X-Large) |
| Credits | Total credits consumed during the selected period |
| % of Total Spend | The warehouse's share of your total credit usage |
| Cost | Cost in dollars |
| Optimization | Whether Yuki optimization is active (Enabled) |
How to Use This Page
- Sort by cost to identify top spenders
- Detect anomalies using the daily chart
- Measure optimization impact alongside the Savings page
Next Step
Set spending limits in the Budget page.