Performance
The Performance page gives you a complete view of how your Snowflake workload behaves over time - execution speed, efficiency, data processing patterns, and workload trends.
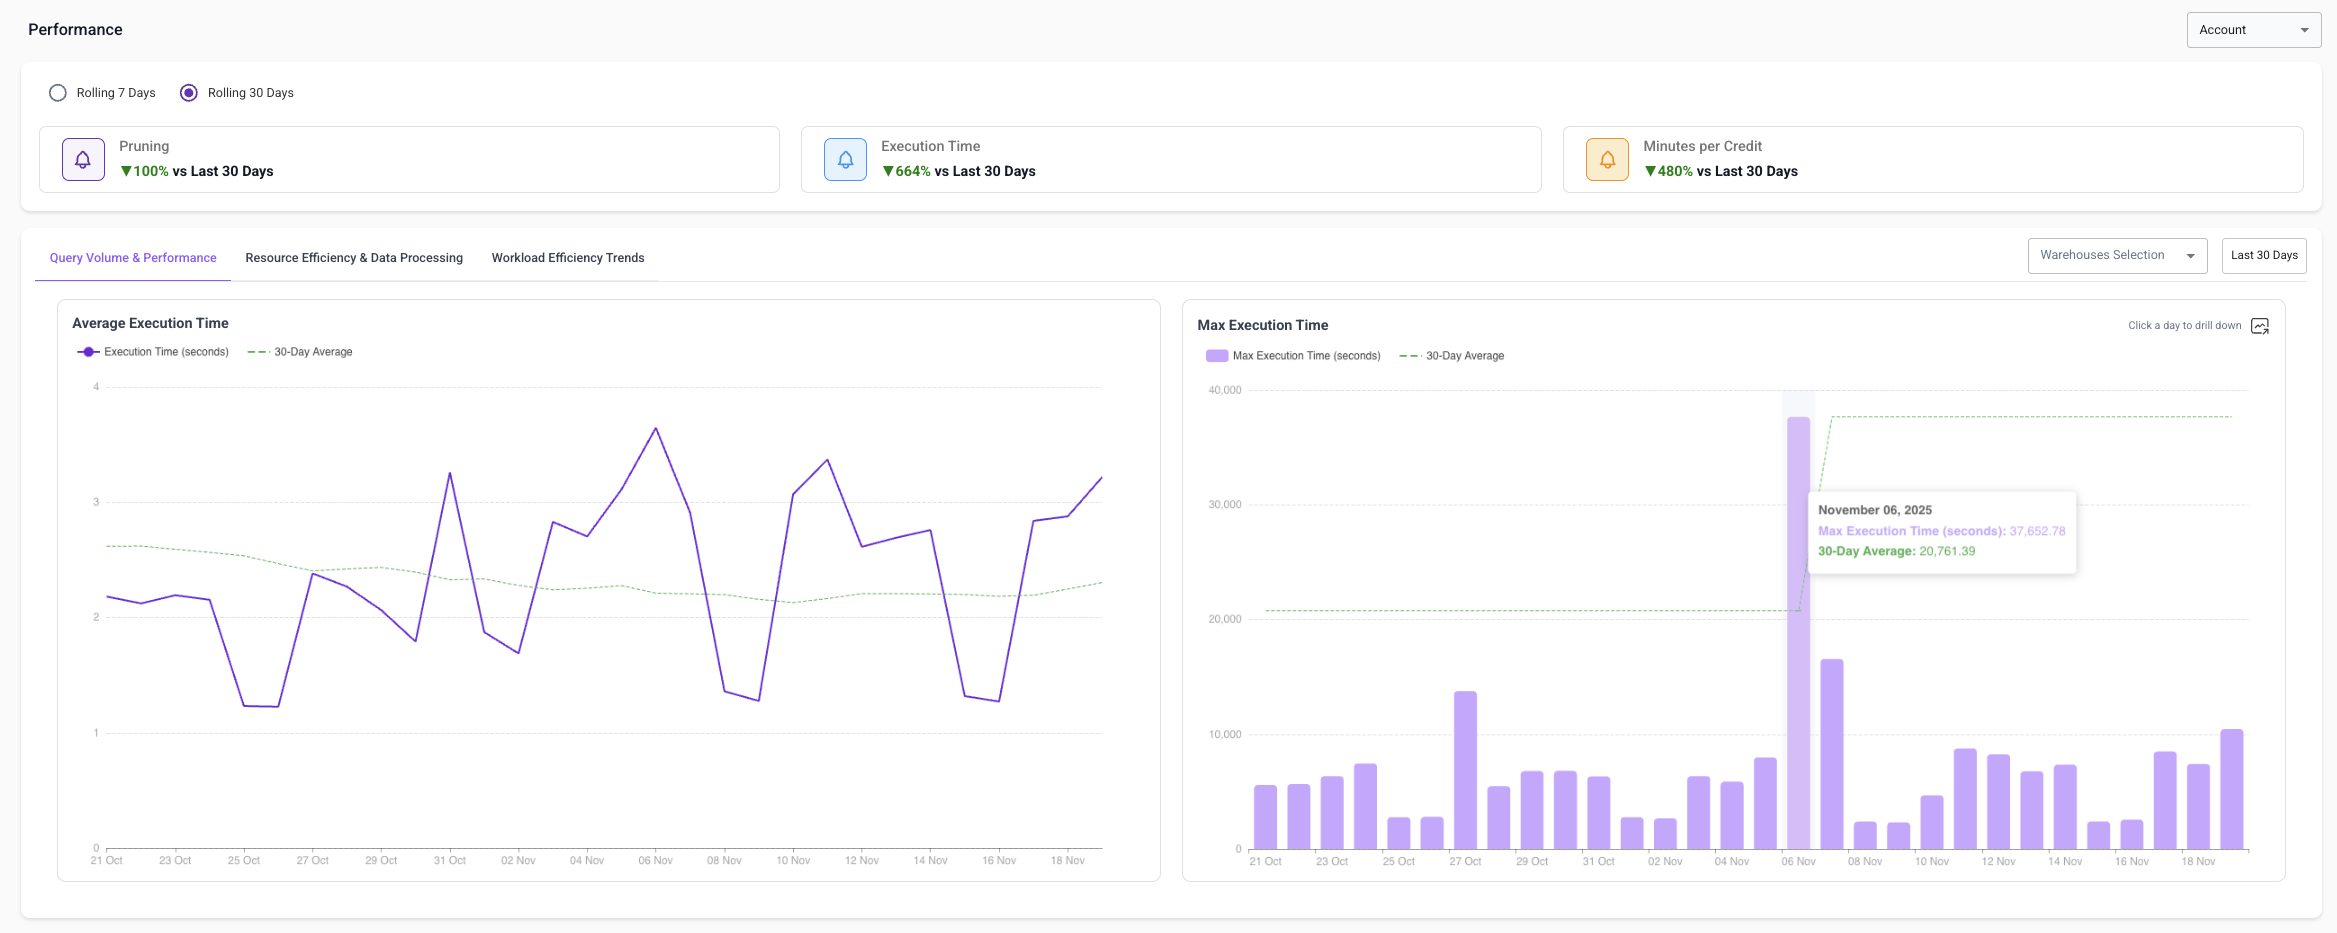
1. Query Volume & Performance
Focuses on the speed of your Snowflake workload.
Average Execution Time
- Track average daily execution time vs. a rolling 30-day baseline
- Identify slowdowns, spikes, or trends
- Validate improvements after query changes or warehouse resizing
Max Execution Time
- Identify inefficient logic, large scans, or bad joins
- Compare max execution time to 30-day norms
- Spot regressions after ETL or dbt changes
Each data point is clickable - opens a drill-down with the top queries that influenced execution time that day.
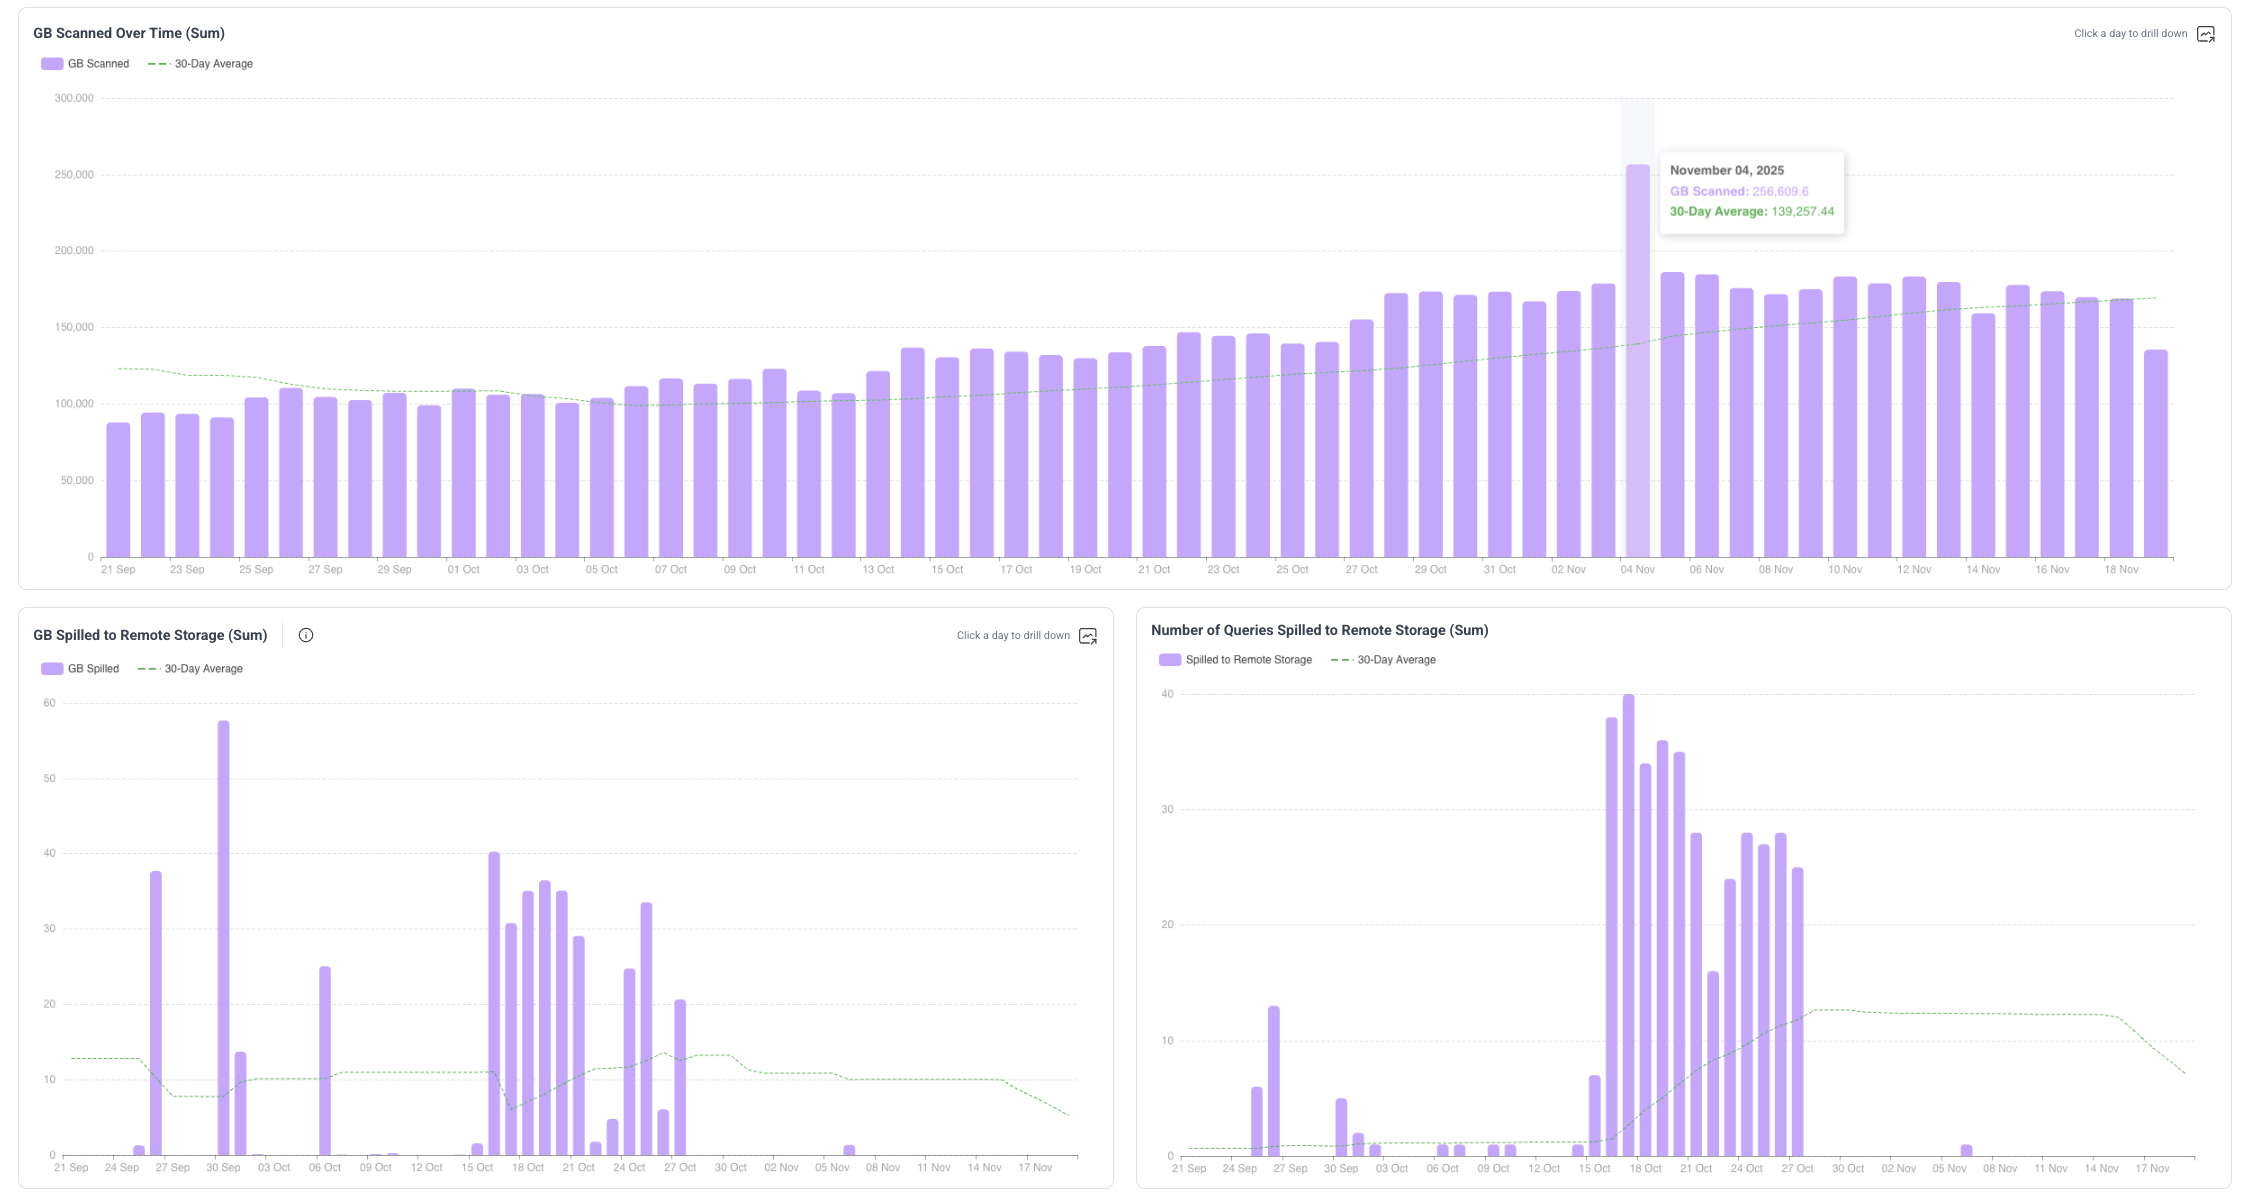
2. Resource Efficiency & Data Processing
Explains how efficiently your data is being processed, which directly influences cost and performance.
GB Scanned Over Time - daily total GB scanned across all queries, overlaid with 30-day average.
GB Spilled to Remote Storage - total GB spilled per day vs. historical norms.
Number of Queries Spilled - helps determine whether spilling is isolated or systemic.
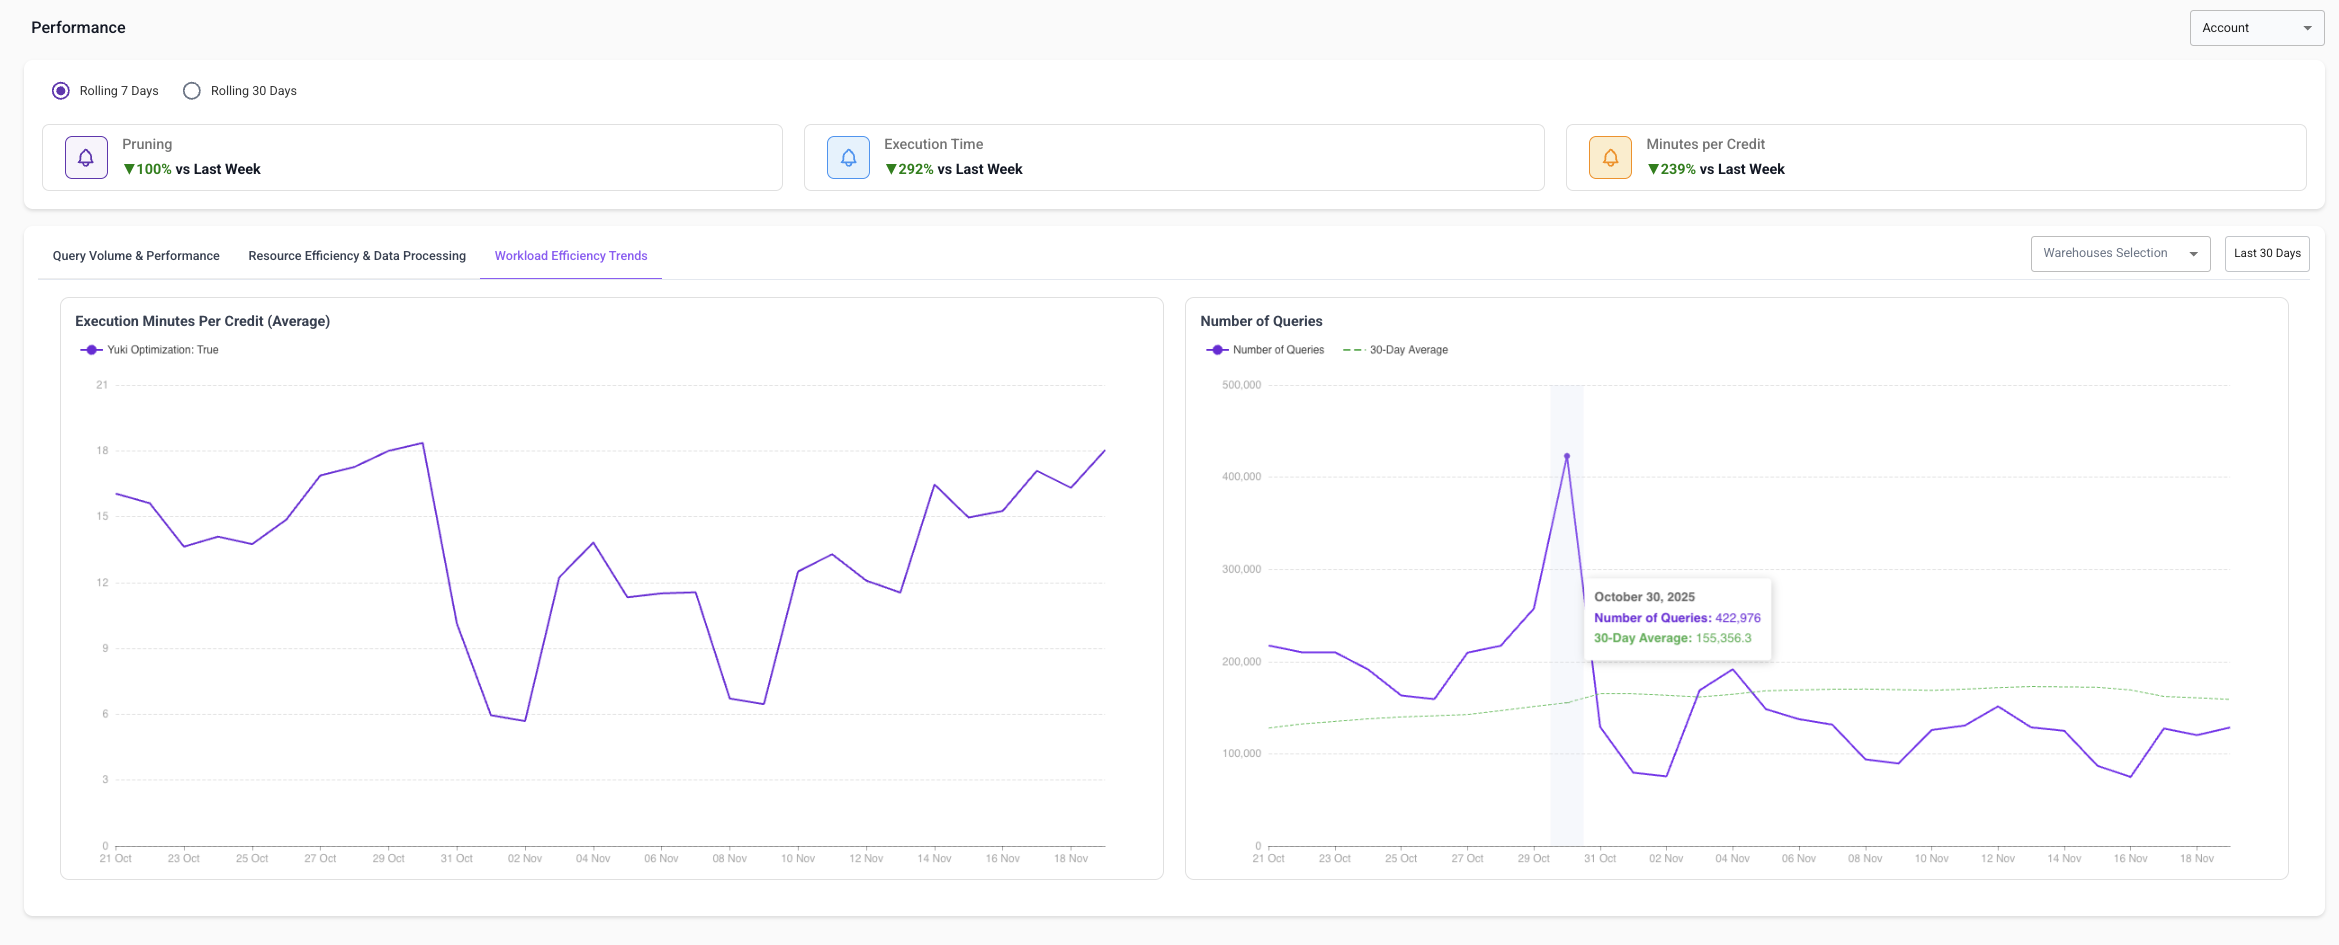
3. Workload Efficiency Trends
Measures how efficiently Snowflake warehouses convert credits into work.
Execution Minutes Per Credit - higher = more efficient.
Number of Queries - detect usage spikes or drops and correlate workload changes with performance changes.
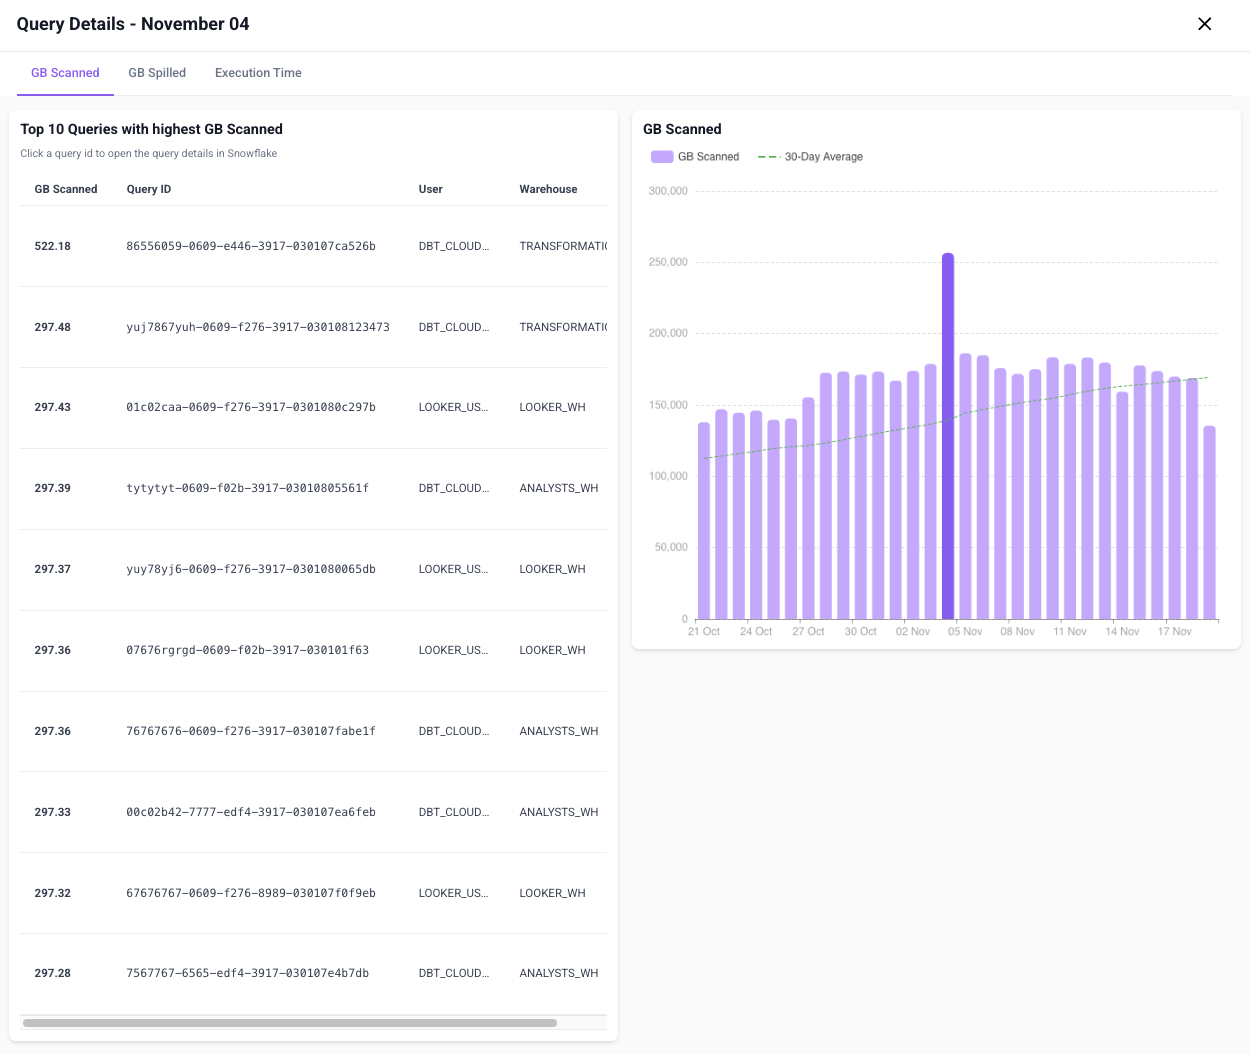
Drill-Downs & Investigations
Most performance views let you click into a specific day to investigate what drove the trend. Inside the drill-down:
- Top 10 queries contributing to that metric
- Exact user, warehouse, and usage details for each query
- Open the exact query in Snowflake to investigate further
Date Controls & Warehouse Filtering
- Choose any date range to explore trends over time
- Filter by individual warehouses to isolate their performance
- Highlight only Yuki-optimized warehouses to understand optimization impact
How to Use This Page
Detect a slowdown: Look for spikes in execution time → click to reveal heavy queries → open in Snowflake.
Validate optimization impact: Compare execution time or minutes per credit before/after enabling Yuki.
Diagnose cost inefficiency: Analyze GB scanned trends and correlate spikes with job/ETL/dbt activity.